Showing heatmap legend
- In the Settings menu, click
Heatmap.
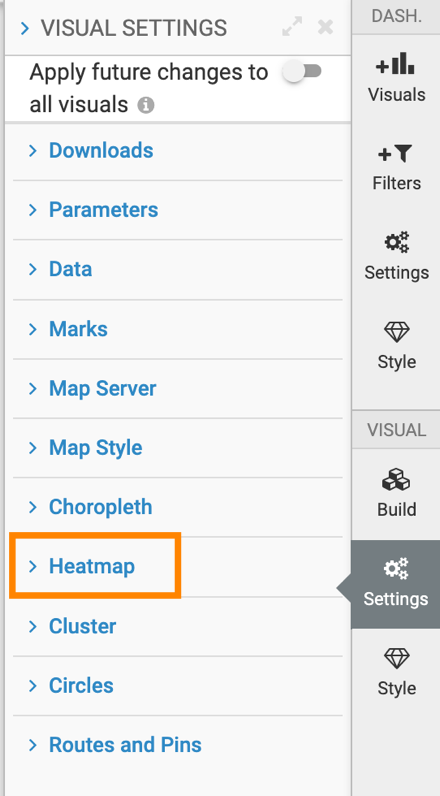
- To show the legend for Heatmap, select or unselect Add
Heatmap Legend option. This option is off by default.

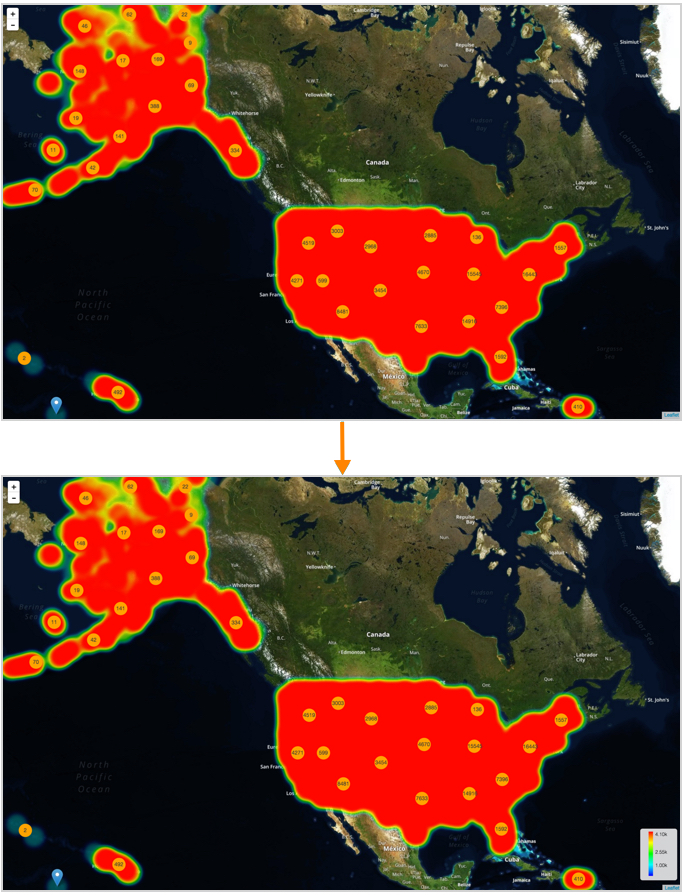
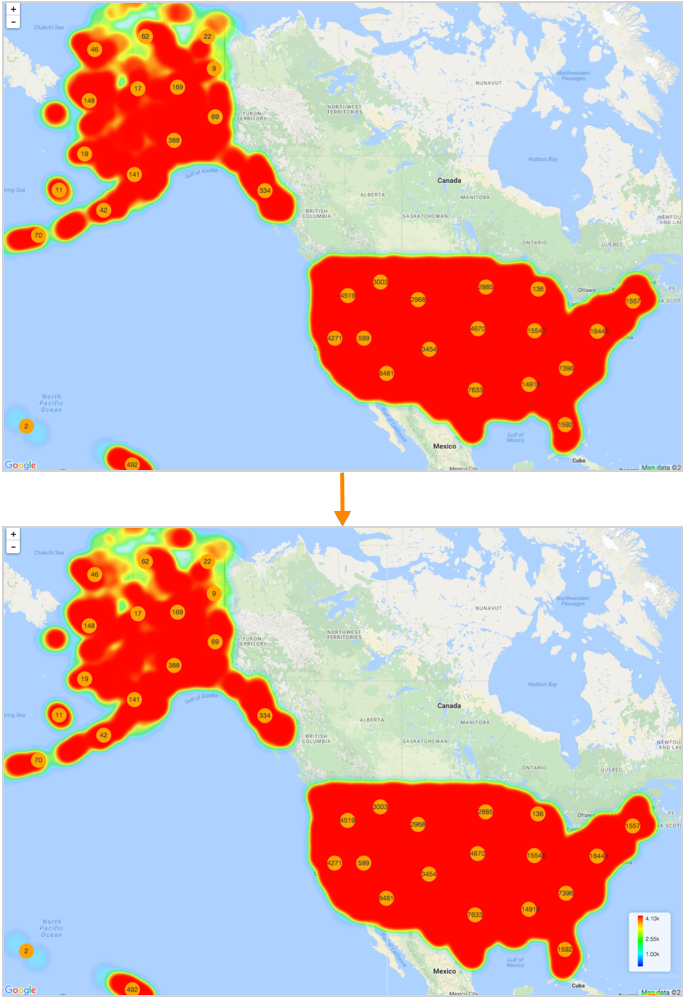
After you enable the legend option, the legend appears in the lower right-corner of the Google map.
Similarly, the legend appears on the Mapbox map.