Showing row totals
In CDP Data Visualization, you can add a totals row to Cross Tabulation visuals.
-
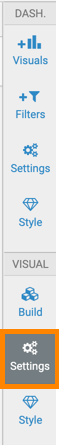
On the right side of Visual Designer, click
Settings in the VISUAL section of the
menu.
-
Open the Data Summary menu and select the Show row
totals option.

For information on column totals, see Showing column totals.
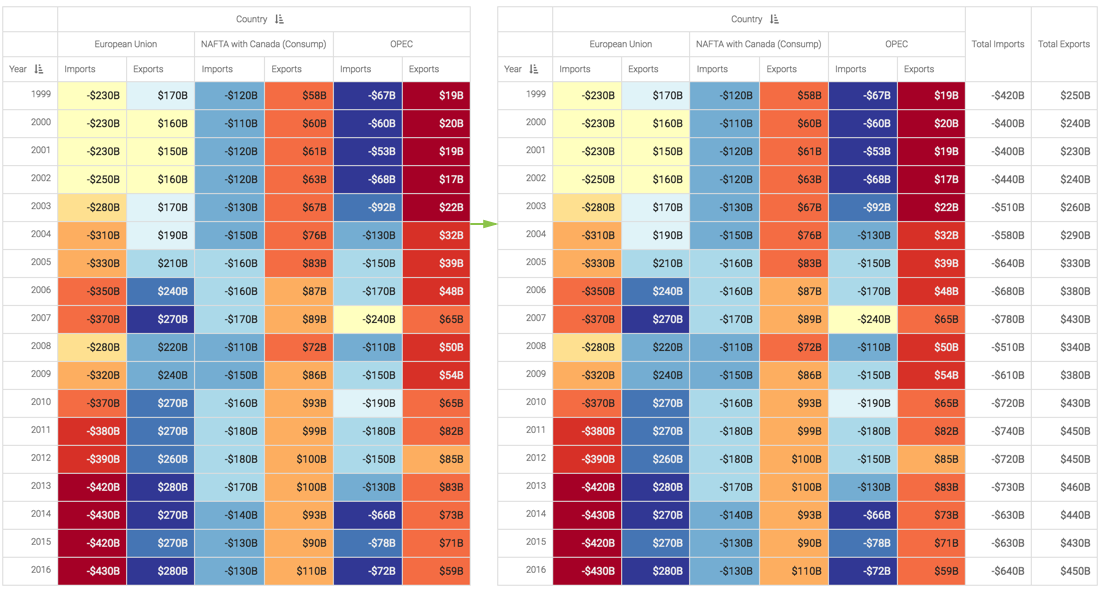
In this example, you can see a visual without row totals, and another visual with row totals added:
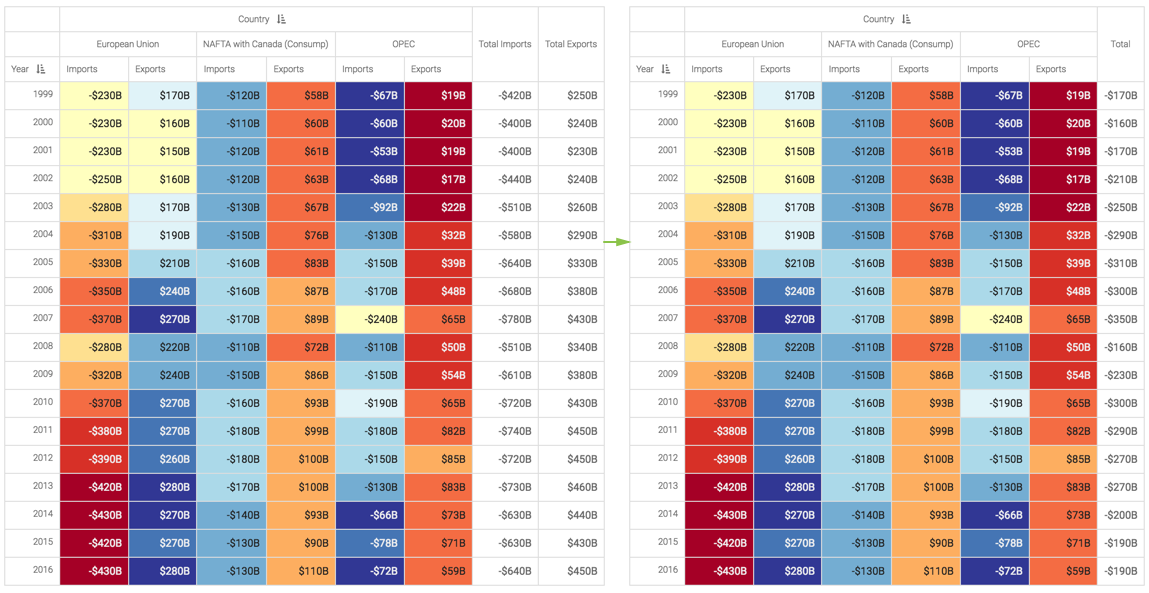
You check the Combine row totals option, if there are multiple measures and at least one dimension in the Column shelf.
In this example, you can see a visual with uncombined totals of the Import and Export columns, and another visual that combines them to show the actual trade deficit.