When you have a dashboard with multiple visuals, you might need to resize and
reorganize the visuals on the dashboard to make it work better for your users. In Cloudera Data Visualizationn, you can easily change the layout of a
dashboard.
By default, visuals are positioned sequentially, aligning
with the order in which you added them to the dashboard. You can reorganize the layout
by resizing or moving around the individual widgets on the dashboard.
Open the dashboard you wish to modify in Edit mode.
On the Dashboard Designer top menu bar, click
LAYOUT.
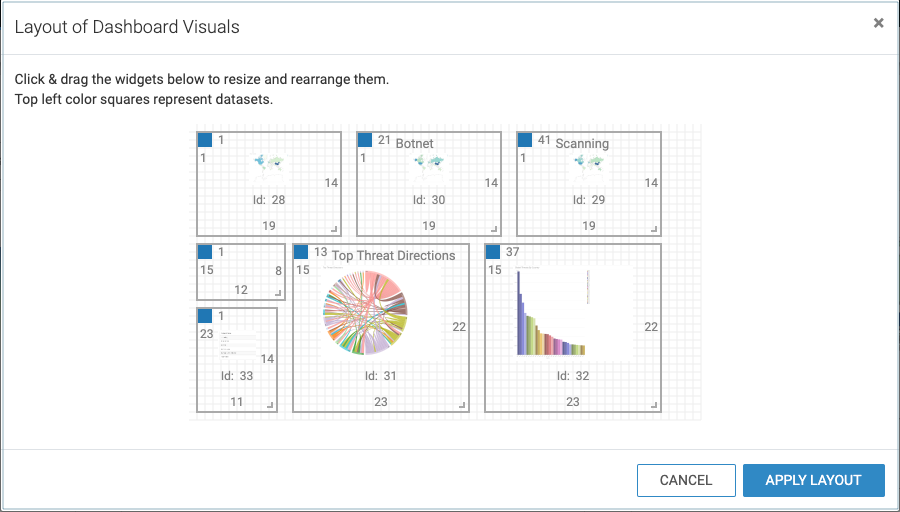
The Layout of Dashboard Visuals modal window
is displayed.
In the modal window there are widgets that provide the following
information about visuals:
Top left color squares represent the datasets associated
with the visuals.
The title of each visual is displayed at the top of its
corresponding widget.
Visual snapshots appear as thumbnails making it easy to
identify the individual visuals on the dashboard.
To reorganize visuals on the canvas, click and drag the widgets to the desired
positions.
To resize a widget, click and drag its bottom-right corner and set the desired
dimensions.
Once you have achieved the desired layout, click APPLY
LAYOUT.
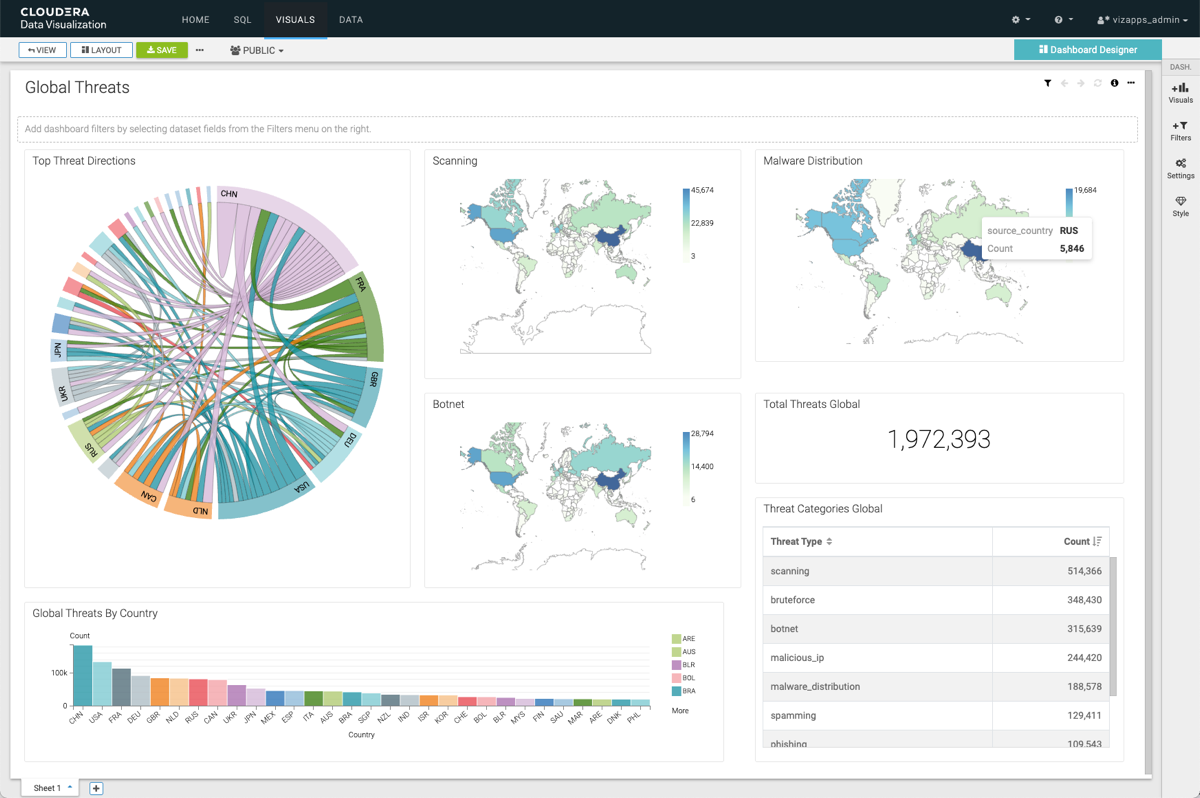
The dashboard layout is updated.In this example, you can see how the dashboard layout
changes after rearranging the widgets on the layout modal.
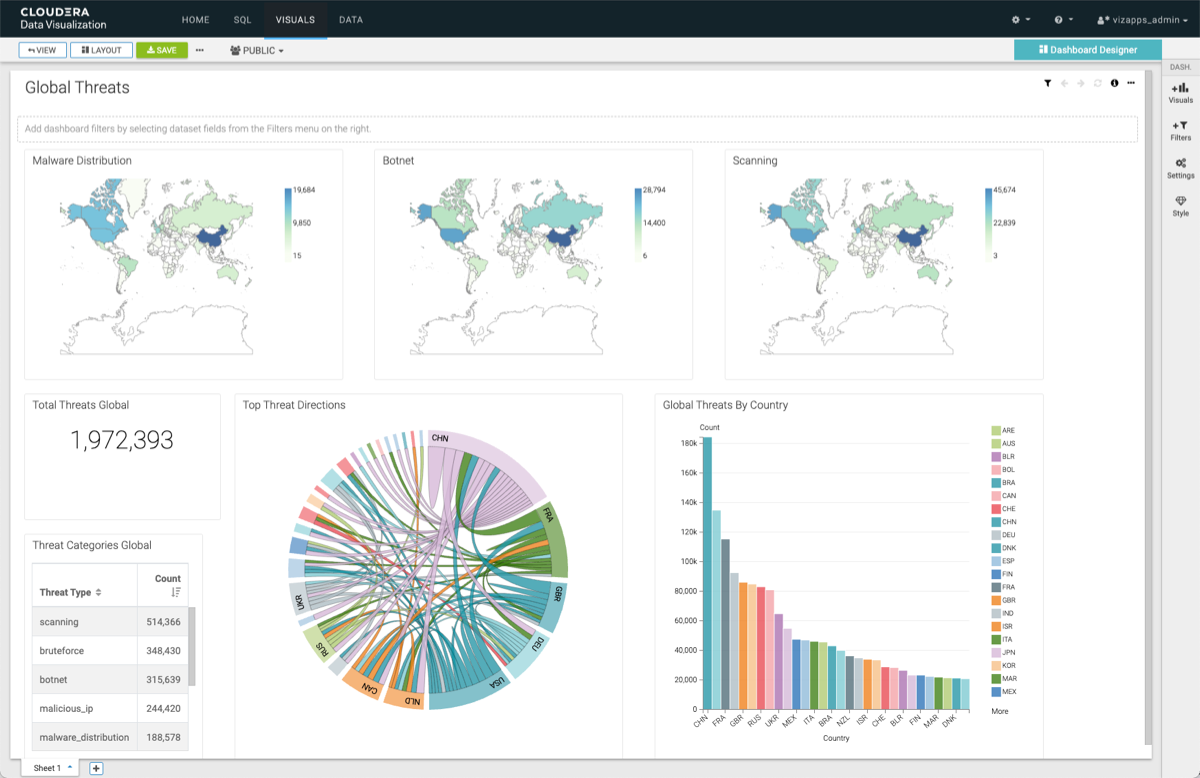
This is the original
dashboard, showing the arrangement of visuals the way it was initially designed:
This is the layout modal of the original dashboard:
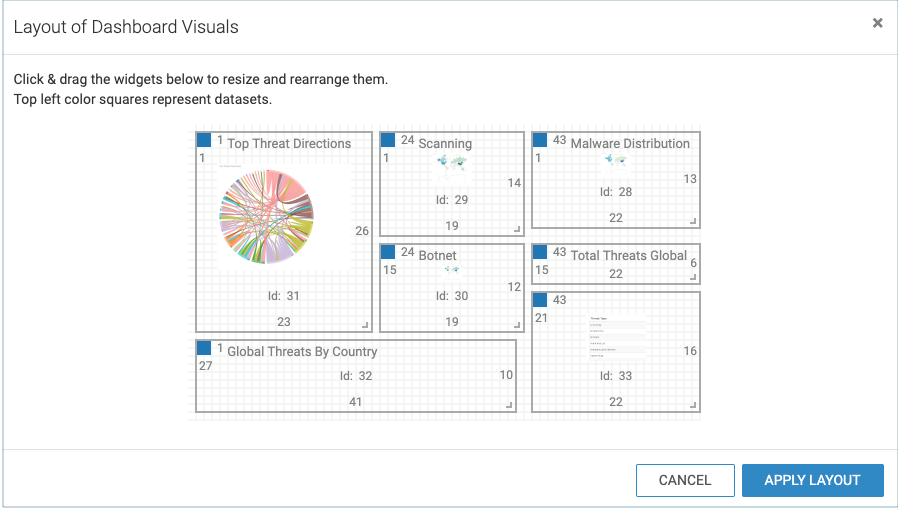
This is the new dashboard layout after rearranging and resizing the
widgets representing the visuals in the dashboard:
This is the updated dashboard after applying the layout
changes: