Chord
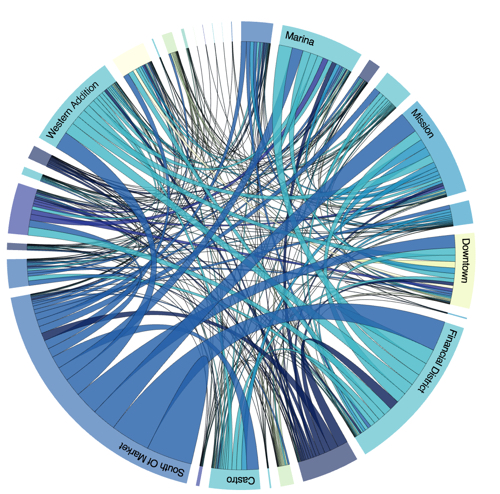
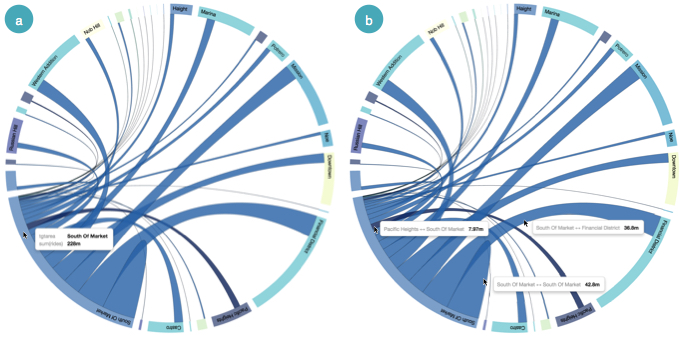
Cloudera Data Visualization enables you to create Chord visuals. These visuals expose the inter-relationships between entities, making them an ideal choice for comparing the similarities within a dataset, or between different groups of data. The nodes/dimensions are on the circumference of a circle, and the relationships between them are the arcs inside the circle. The size of the node is proportional to the measurement. Cloudera Data Visualization uses color to help distinguish the overlapping relationship arcs.
Chord visuals are similar to Correlation Heatmaps because they both compare exactly two dimensions. Chords, however, plot dimensions that cover the same value domain, and are better at pointing out the presence of a relationship between nodes than the relative magnitude of that relationship.
The following steps demonstrate how to create a new chord visual on the SF Cabrides
dataset. This dataset is based on data previously imported into Cloudera Data Visualization from a datafile. Each distinct line segment between two
dimensions reports the correlation data. Because the values for pick-up and drop-off areas,
srcarea and tgtarea , are in the same domain, it makes
the dataset ideal for demonstrating chord visuals.
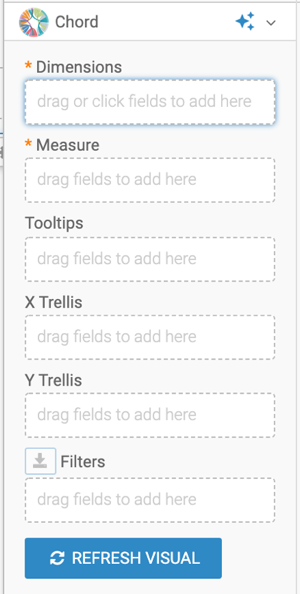
For an overview of shelves that specify this visual, see Shelves for chord visuals.


