Dendrograms
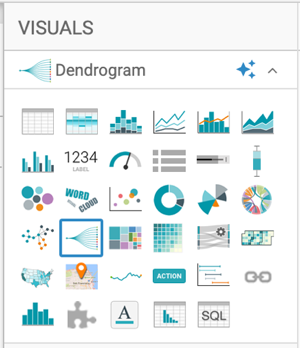
Cloudera Data Visualization enables you to create Dendrogram visuals. Dendrograms are good at expressing hierarchical relationships in data. As the name derivation suggests (Greek 'dendro' for 'tree' and 'gramma' for 'drawing'), dendrograms are tree diagrams.
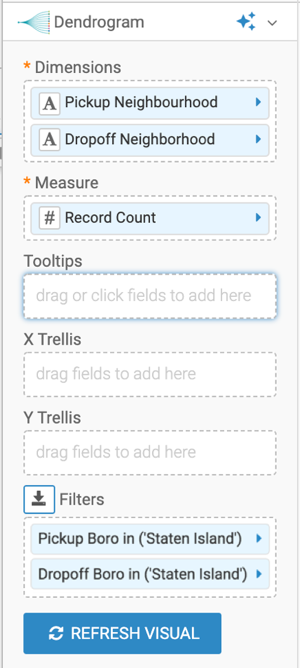
In the following example the NYC Taxi Data for year 2013 dataset is used. You can download a subset of this data for trips made within Staten Island boro, upload it, and create the dataset NYC Taxi Data.
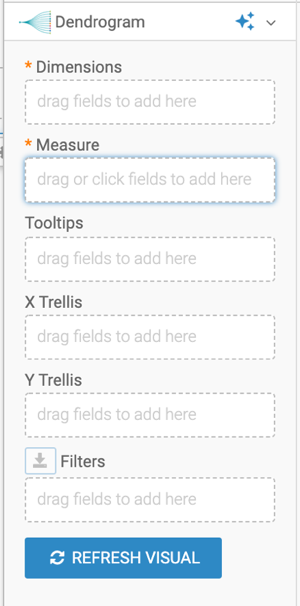
For an overview of shelves that specify this visual, see Shelves for dendogram visuals.
To adjust the dendrogram display, check all the available settings for this visual.


