Activity Log
Logs and Usage is a monitoring interface that helps you understand how users interact with Cloudera Data Visualization in your organization. It provides access to raw log files that you can download in their original format, packaged as a ZIP archive for easier troubleshooting and sharing. The interface includes multiple tabs that present detailed information about user activities, system load, and runtime performance.
The Activity Log menu provides access to the audit logs stored in query log files. You can access it from .
When you open the Activity Log, you can see a list view of the activity logs by default. This view provides comprehensive details about each activity.
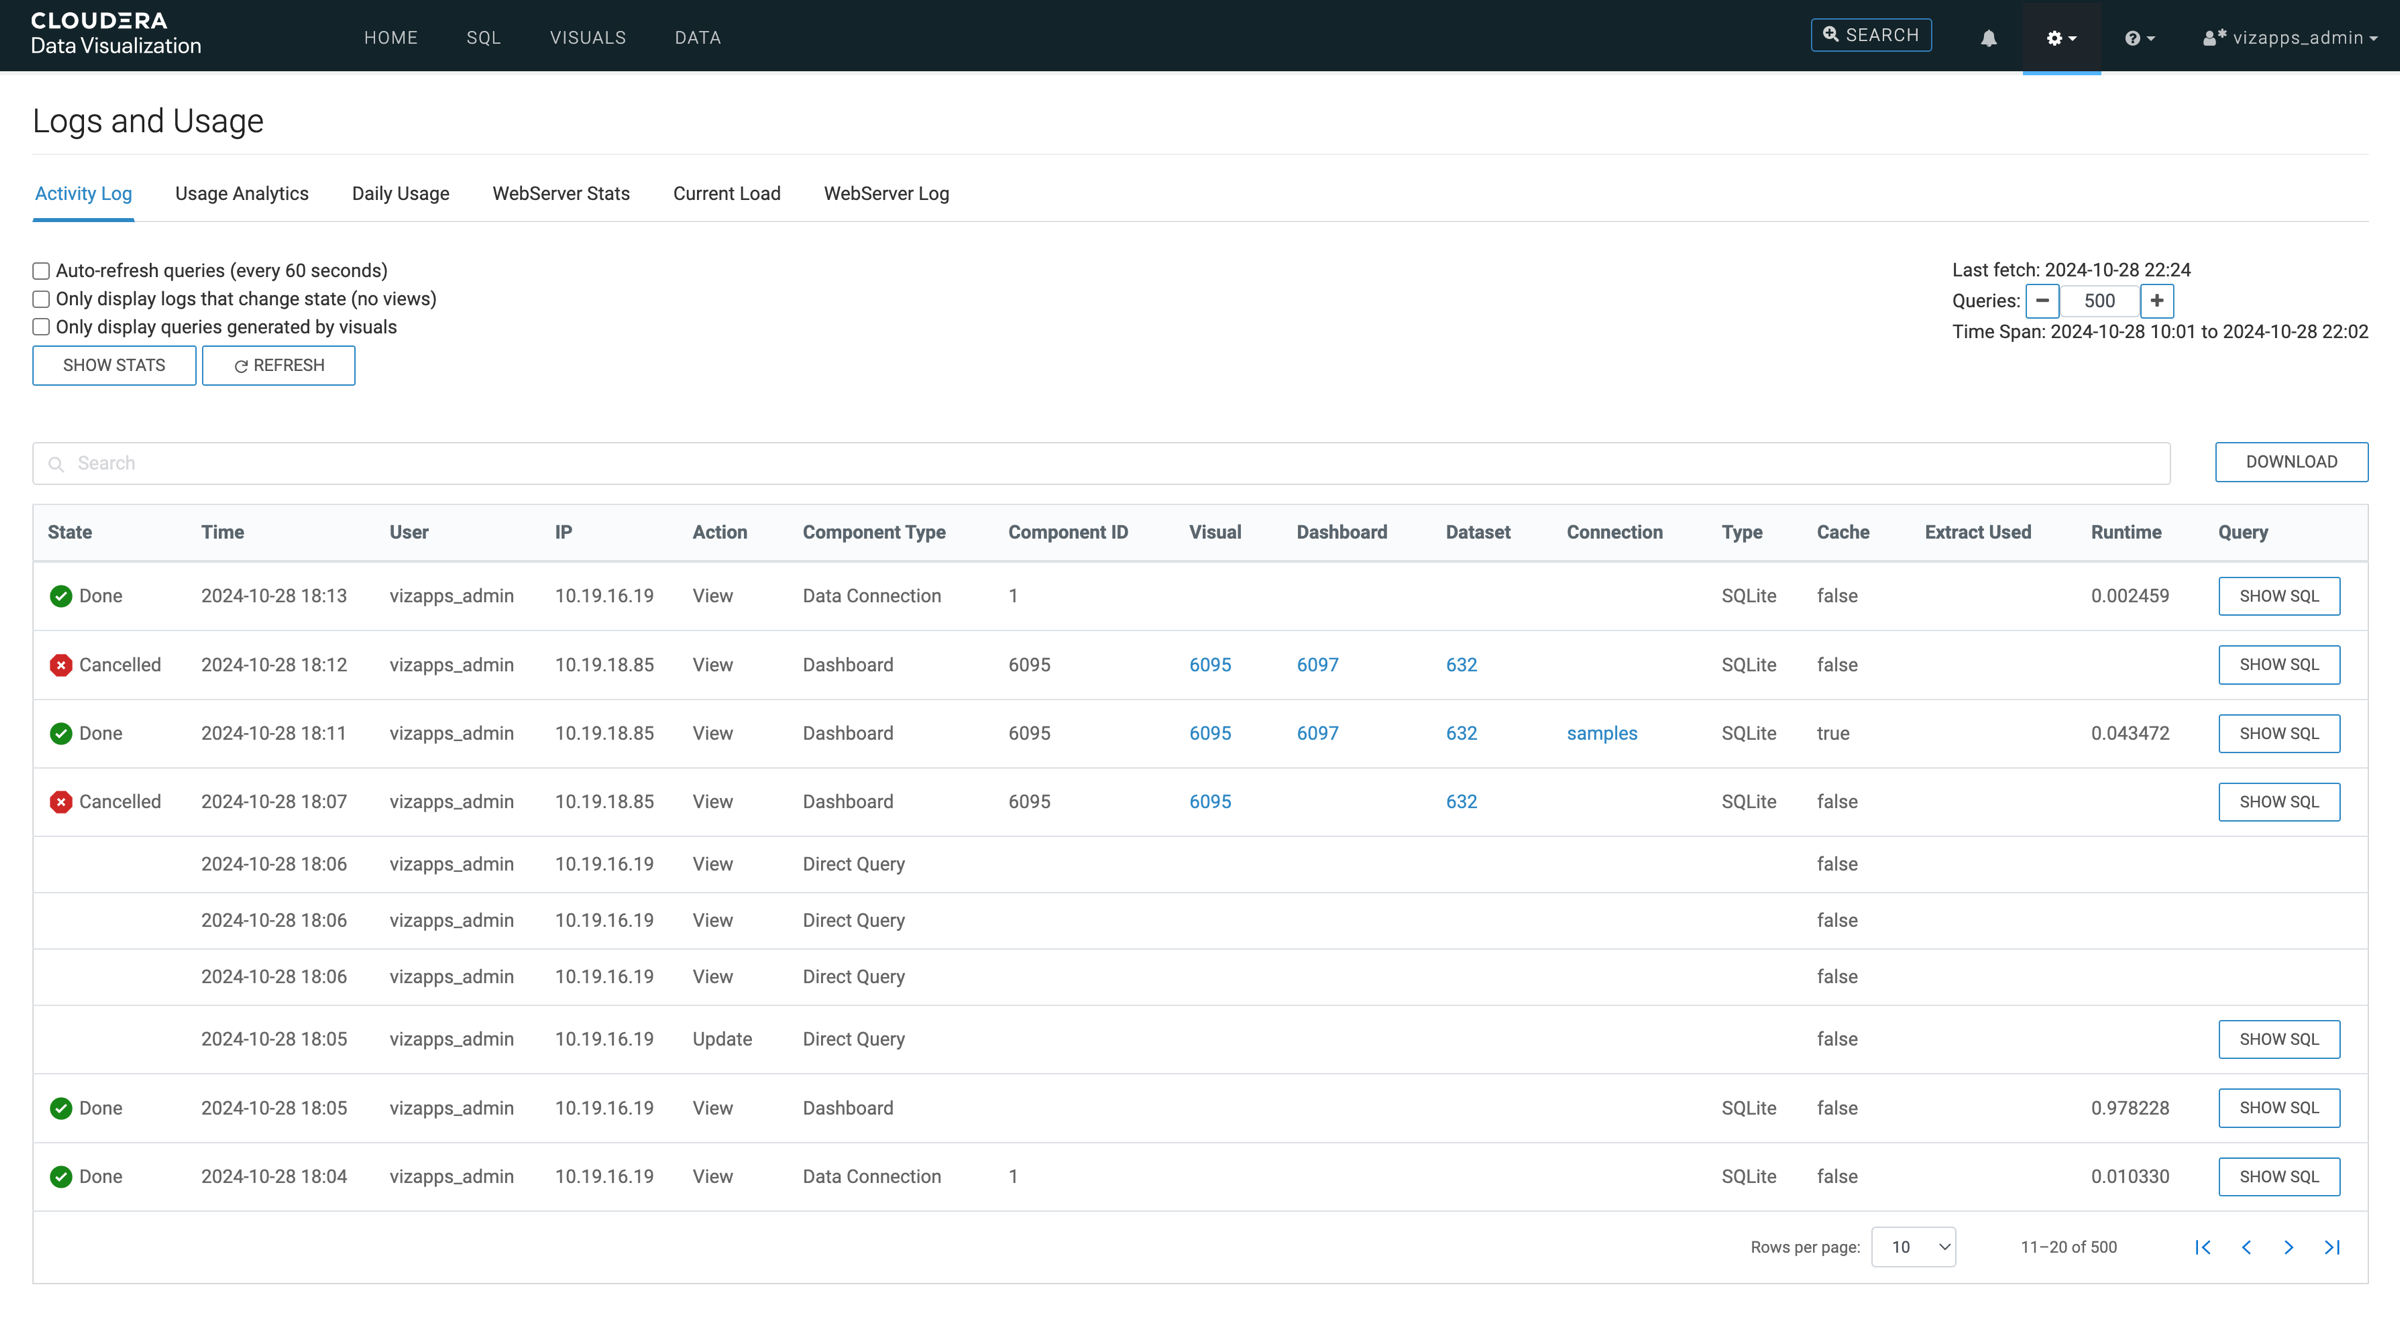
Key functions

-
Auto-refresh queries
Enabling this option automatically updates the information displayed in the interface every 60 seconds.
-
Only display logs that change state
You can use this option to filter the logs, showing only actions that alter the state of artifacts.
-
Only display queries generated by visuals
You can use this option to narrow the reporting to actions related to visuals. It excludes actions on datasets, connections, and analytical views from the logs.
-
Show Stats/Hide Stats
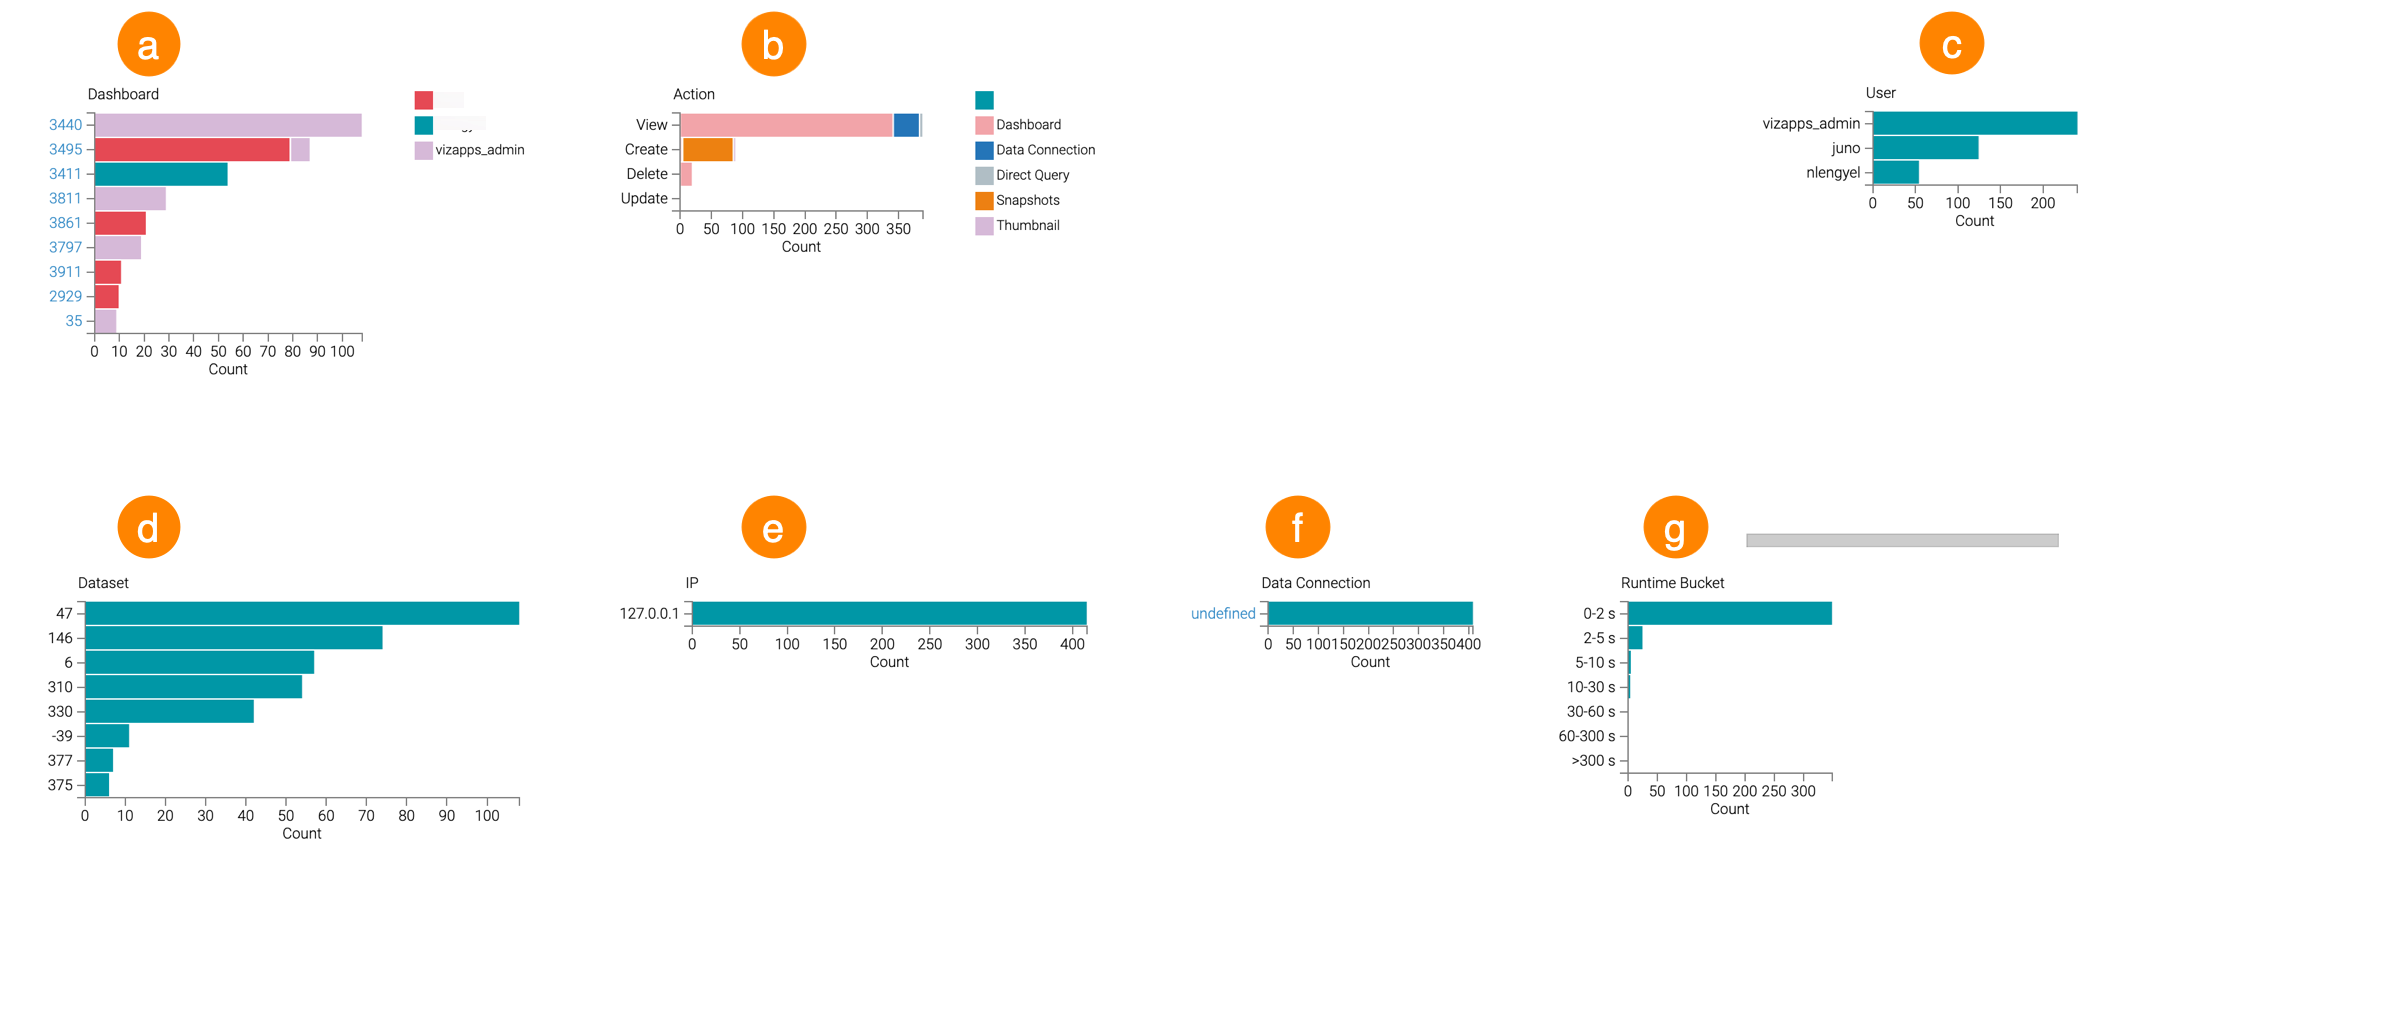
You can use this option to display or hide statistical visualizations of the activity logs based on object type.
-
Dashboard
The horizontal bar chart shows the most frequently accessed dashboards, identified by their unique IDs.
Click a dashboard ID to open the dashboard in a new browser tab. Hover over a bar to view details such as dashboard ID, activity count, dataset ID, and dataset name.
-
Action
The horizontal stacked bar chart groups activities by action, such as View, Update, and Create. Each bar is divided by component type, such as Dashboard, Data Connection, Dataset, Snapshots, Thumbnail, or User.
Hover over a bar segment to view the action, activity count, and associated component type.
-
Queries returned from backend VS cache
The horizontal stacked bar chart shows the number of queries associated with each data connection and indicates how the results were obtained:
- Backend: The SQL query was executed against the underlying data source.
- Cache: Previously cached results were returned without executing the SQL query again.
Hover over a bar segment to view the data connection, result source, and query count.
-
User
The horizontal bar chart shows the users who initiated activities and the number of activities associated with each user.
Hover over a bar to view the username and activity count.
-
Dataset
The horizontal bar chart shows the most frequently accessed datasets, identified by their unique IDs.
Hover over a bar to view details such as the dataset ID, name, and activity count.
-
IP
The horizontal bar chart groups activities by the IP address of the computer from which each activity was initiated.
Hover over a bar to view the IP address and activity count.
-
Data Connection
The horizontal bar chart shows the number of activities associated with each data connection.
Click a data connection name to open its Datasets page. Hover over a bar to view the connection name and activity count.
-
Runtime Bucket
The horizontal bar chart groups SQL queries into runtime ranges, such as 0–2 seconds, 2–5 seconds, and 5–10 seconds. Each bar shows the number of queries completed within that range.
Hover over a bar to view the runtime range and query count.
-
-
Refresh
This option triggers an immediate refresh operation, bypassing the waiting period for auto-refresh.
-
Information section on the right side of the page:
-
Last fetch
This timestamp captures the moment when the query was generated.
-
Queries
This indicates the number of queries currently reported.
The default value is 500. You can increase the number of queries by clicking the + icon incrementing them in multiples of 500. Conversely, clicking the - icon decreases the number of queries in increments of 500.
-
Time Span
This time period reports the interval covered by the log data.
-
-
Search
You can look up multiple terms, separated by spaces. The search results will show records that contain all the specified terms.
List view
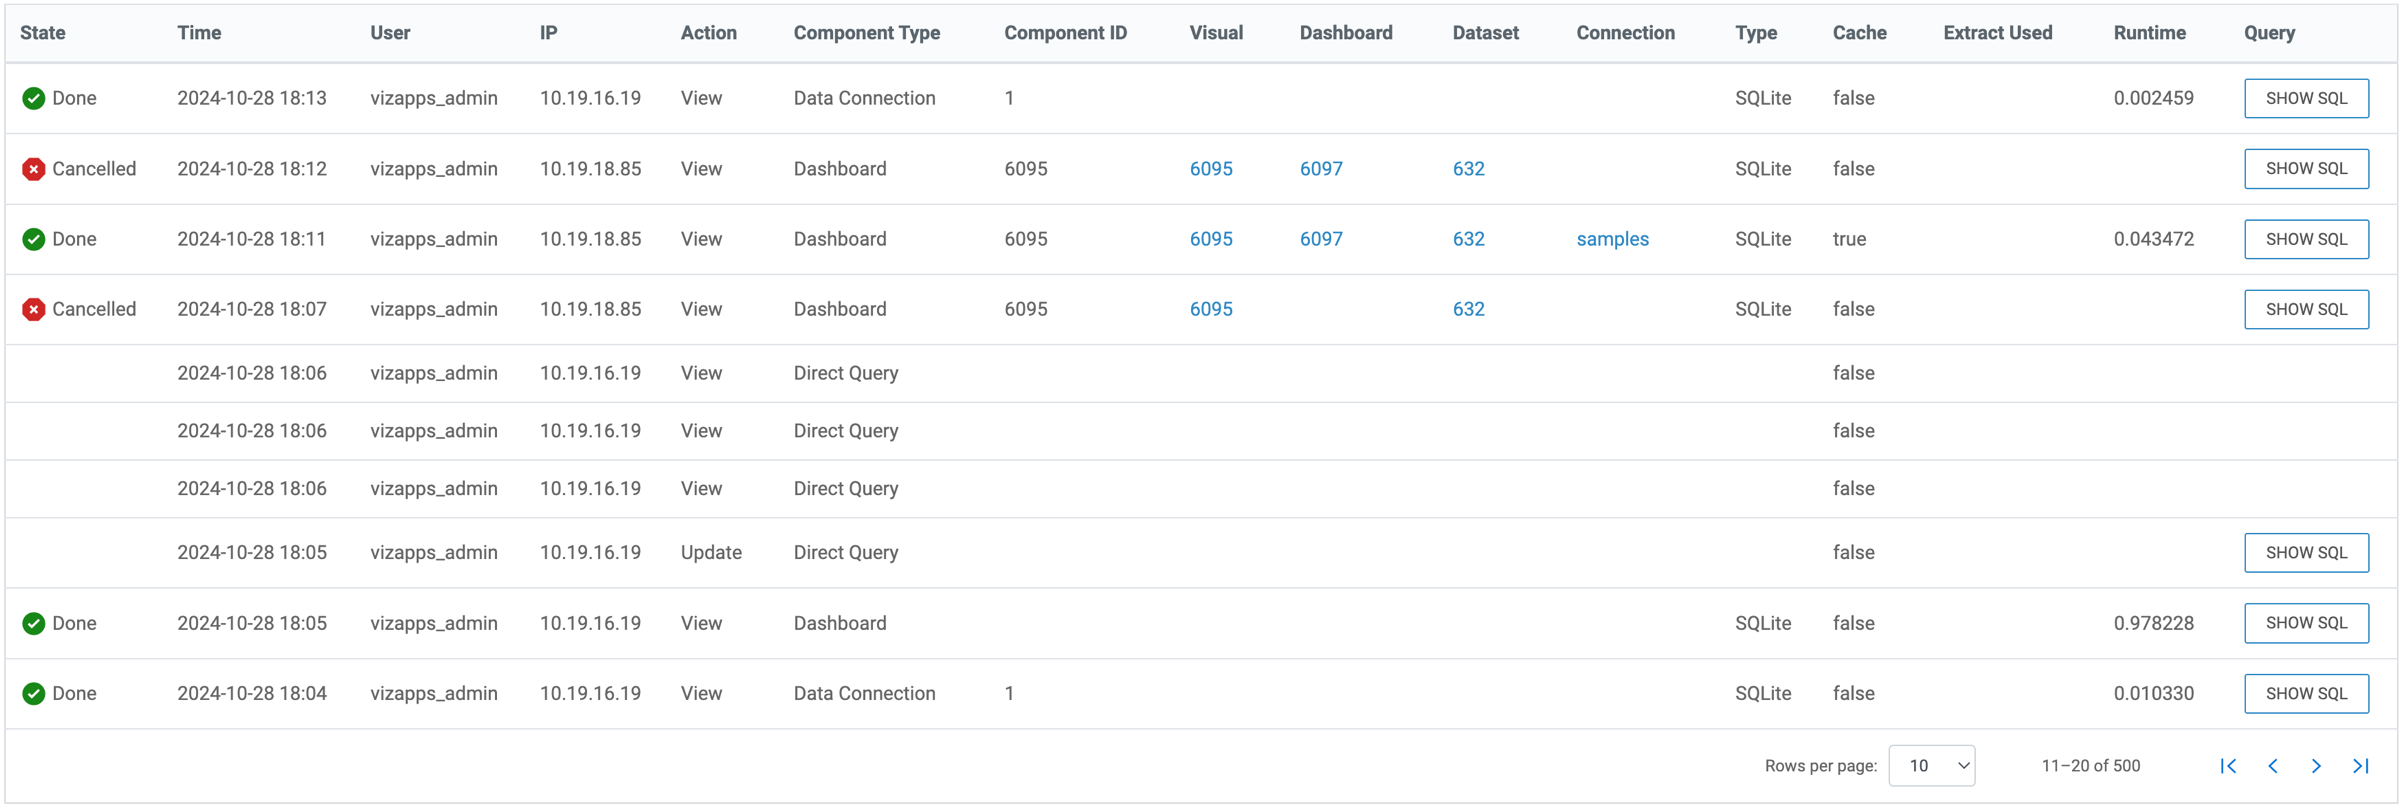
You can check the list view of the Activity Log to get more detailed information about past activities.
By default, the log displays the last 500 activities in reverse chronological order, with the most recent action appearing at the top.
-
State indicates the completion status of the SQL query. Possible values are: Started, Done, Queued, Cancelled, Abandoned, Error.
-
Time displays the date and time of the audited action.
-
User shows the username of the person who initiated the activity (if available).
-
IP provides the IP address of the computer used by the user carrying out the action (if available).
-
Action indicates the type of event that triggered the logged activity (View, Create, Update, Delete).
-
Component Type specifies the category of the activity (Dashboard, Data Connection, Dataset, User, App, Custom Style, Custom Color, Snapshots, Thumbnail, Static Asset, Role, Custom Email, Custom Date Range, Workspace, Search, Direct Query, Segment, Filter Association, Job, Extract).
-
Component ID reflects the ID of the component involved in the action.
-
Visual displays the ID of the visual that generated the action or is the target of the action. You can click this number to navigate to the visual.
-
Dashboard displays the ID of the dashboard that generated the action or is the target of the action. You can click this number to navigate to the dashboard.
-
Dataset displays the ID of the dataset that generated the action or is the target of the action. You can click this number to access the Dataset Detail interface for that dataset.
-
Connection displays the ID of the data connection associated with the activity. You can click this name to navigate to the Datasets interface for that connection.
-
Type specifies the type of data connection (for example: SQLite, Hive, Impala).
-
Cache indicates whether the query was served from the cache instead of executing the SQL query. Possible values are true or false.
-
Extract Used shows when SQL query rewriting is enabled. A link to a data extract indicates that the query was redirected to a different data table.
-
Runtime shows the execution time of the SQL query in seconds (if SQL execution is involved).
-
Query shows the SQL query statement (when available). By default, Cloudera Data Visualization hides the SQL statements. To view a specific query, click Show SQL. To hide statements, click Hide SQL.