Current Load
Logs and Usage is a monitoring interface that helps you understand how users interact with Cloudera Data Visualization in your organization. It provides access to raw log files that you can download in their original format, packaged as a ZIP archive for easier troubleshooting and sharing. The interface includes multiple tabs that present detailed information about user activities, system load, and runtime performance.
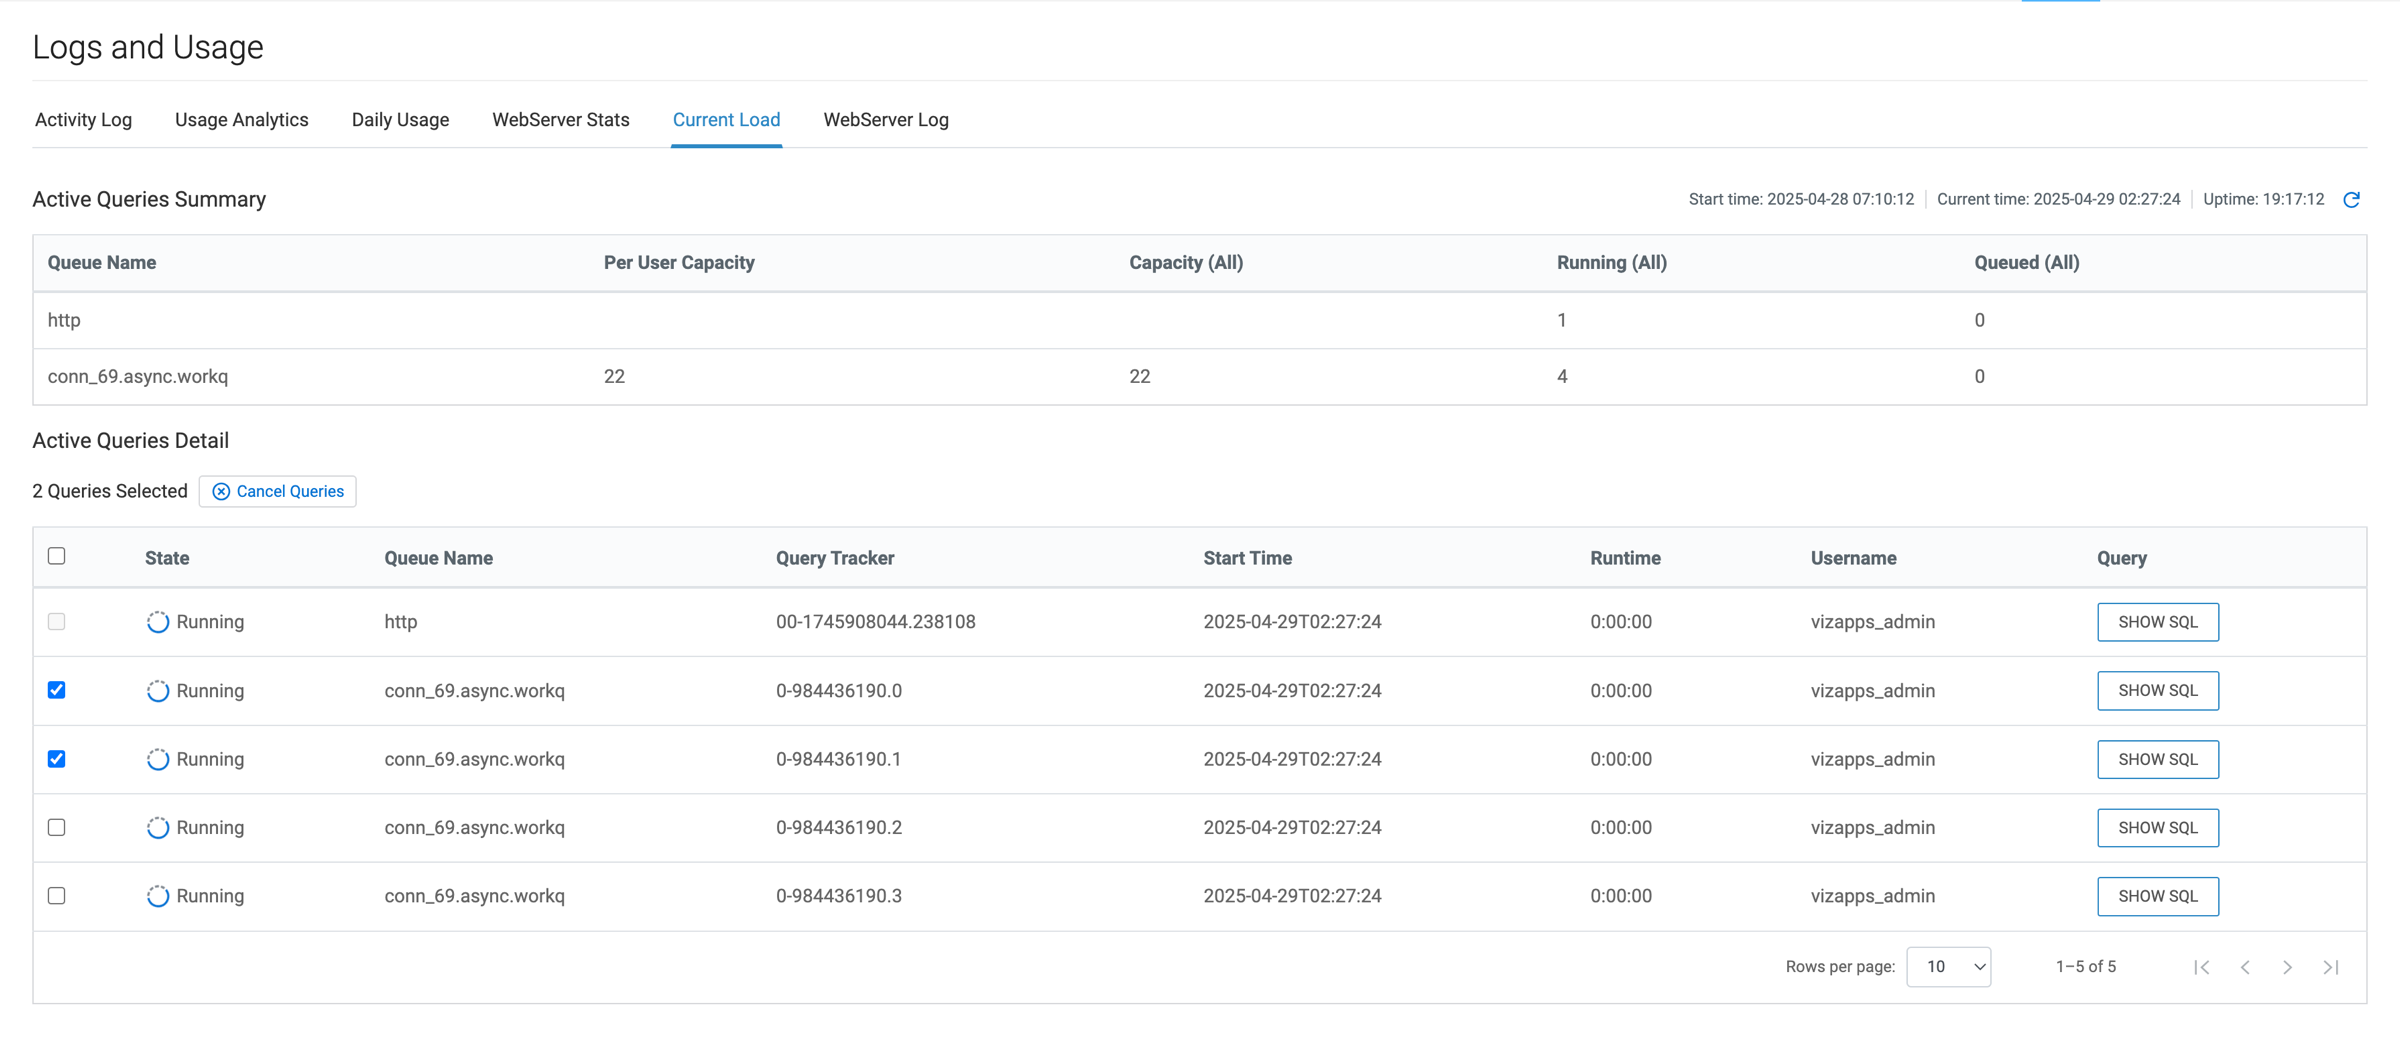
The Current Load tab of the interface offers the convenience of viewing essential information in real-time and provides a quick way to manage ongoing queries by canceling them if needed. You can access it from .
Current Load provides the following information:
- Active Queries Summary showing real-time, system-wide view of all active queries. This summary is aggregated and does not include user-specific details.
- Active Queries Detail showing detailed information about active queries with user-specific details.
You can manage running queries directly from this interface:
- Cancel all running queries in bulk, or cancel individual queries for finer control.
- Cloudera Data Visualization provides clear, real-time feedback on the status of each canceled query.