Daily Usage
Logs and Usage is a monitoring interface that helps you understand how users interact with Cloudera Data Visualization in your organization. It provides access to raw log files that you can download in their original format, packaged as a ZIP archive for easier troubleshooting and sharing. The interface includes multiple tabs that present detailed information about user activities, system load, and runtime performance.
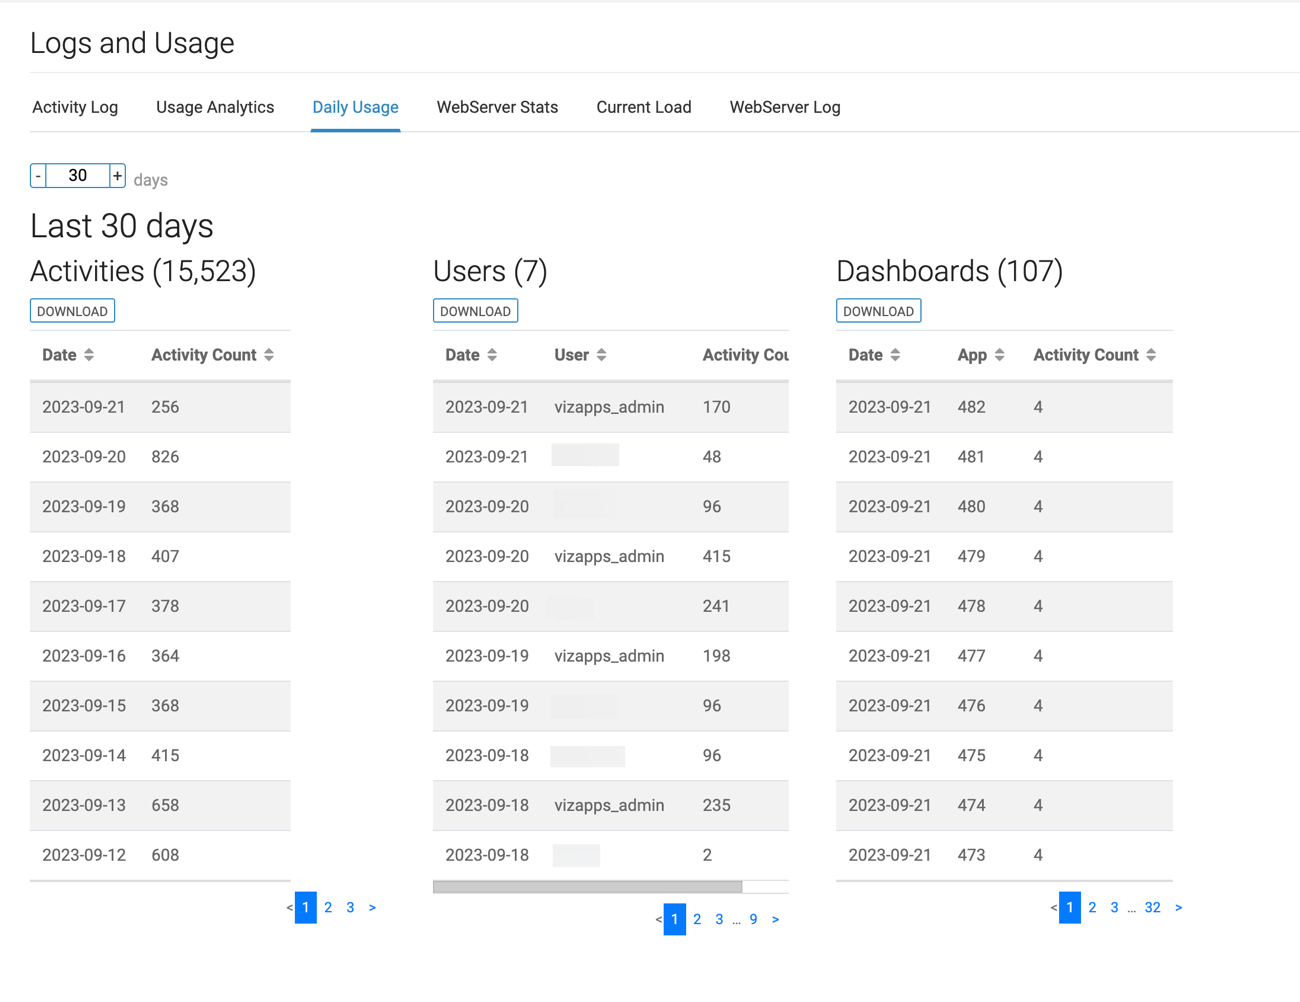
The Daily Usage tab of the interface presents audit log data grouped by day and provides insight into user activity, dashboards, and system usage trends. You can access this tab from .
-
Activities – provides a detailed view of all audit events recorded on a given day, including actions like create, read, write, and delete operations.
-
Users – presents audit events categorized by day and user, showing the number of audited actions associated with each user.
-
Dashboards – shows the number of activities impacting or related to visual components, grouped by date and dashboard or visual ID.
By default, Daily Usage shows data for the last 30 days. You can customize the time range to analyze activity over a different period.
You can download the collected data, allowing you to perform further analysis or integrate the data with other tools and systems.