Creating a dashboard
You can create dashboards in Cloudera Data Visualization to organize and display multiple visuals based on your data.
-
You can start creating a dashboard from several locations in the
application.
- Click NEW DASHBOARD in the top-right corner of the main HOME interface.
- Click in the top-right corner of the preview area in the VISUALS interface.
- Click
 next to the name of a dataset on the
DATA interface.
next to the name of a dataset on the
DATA interface. - Click NEW DASHBOARD in the top-right corner of the Dataset Detail view for a particular dataset.
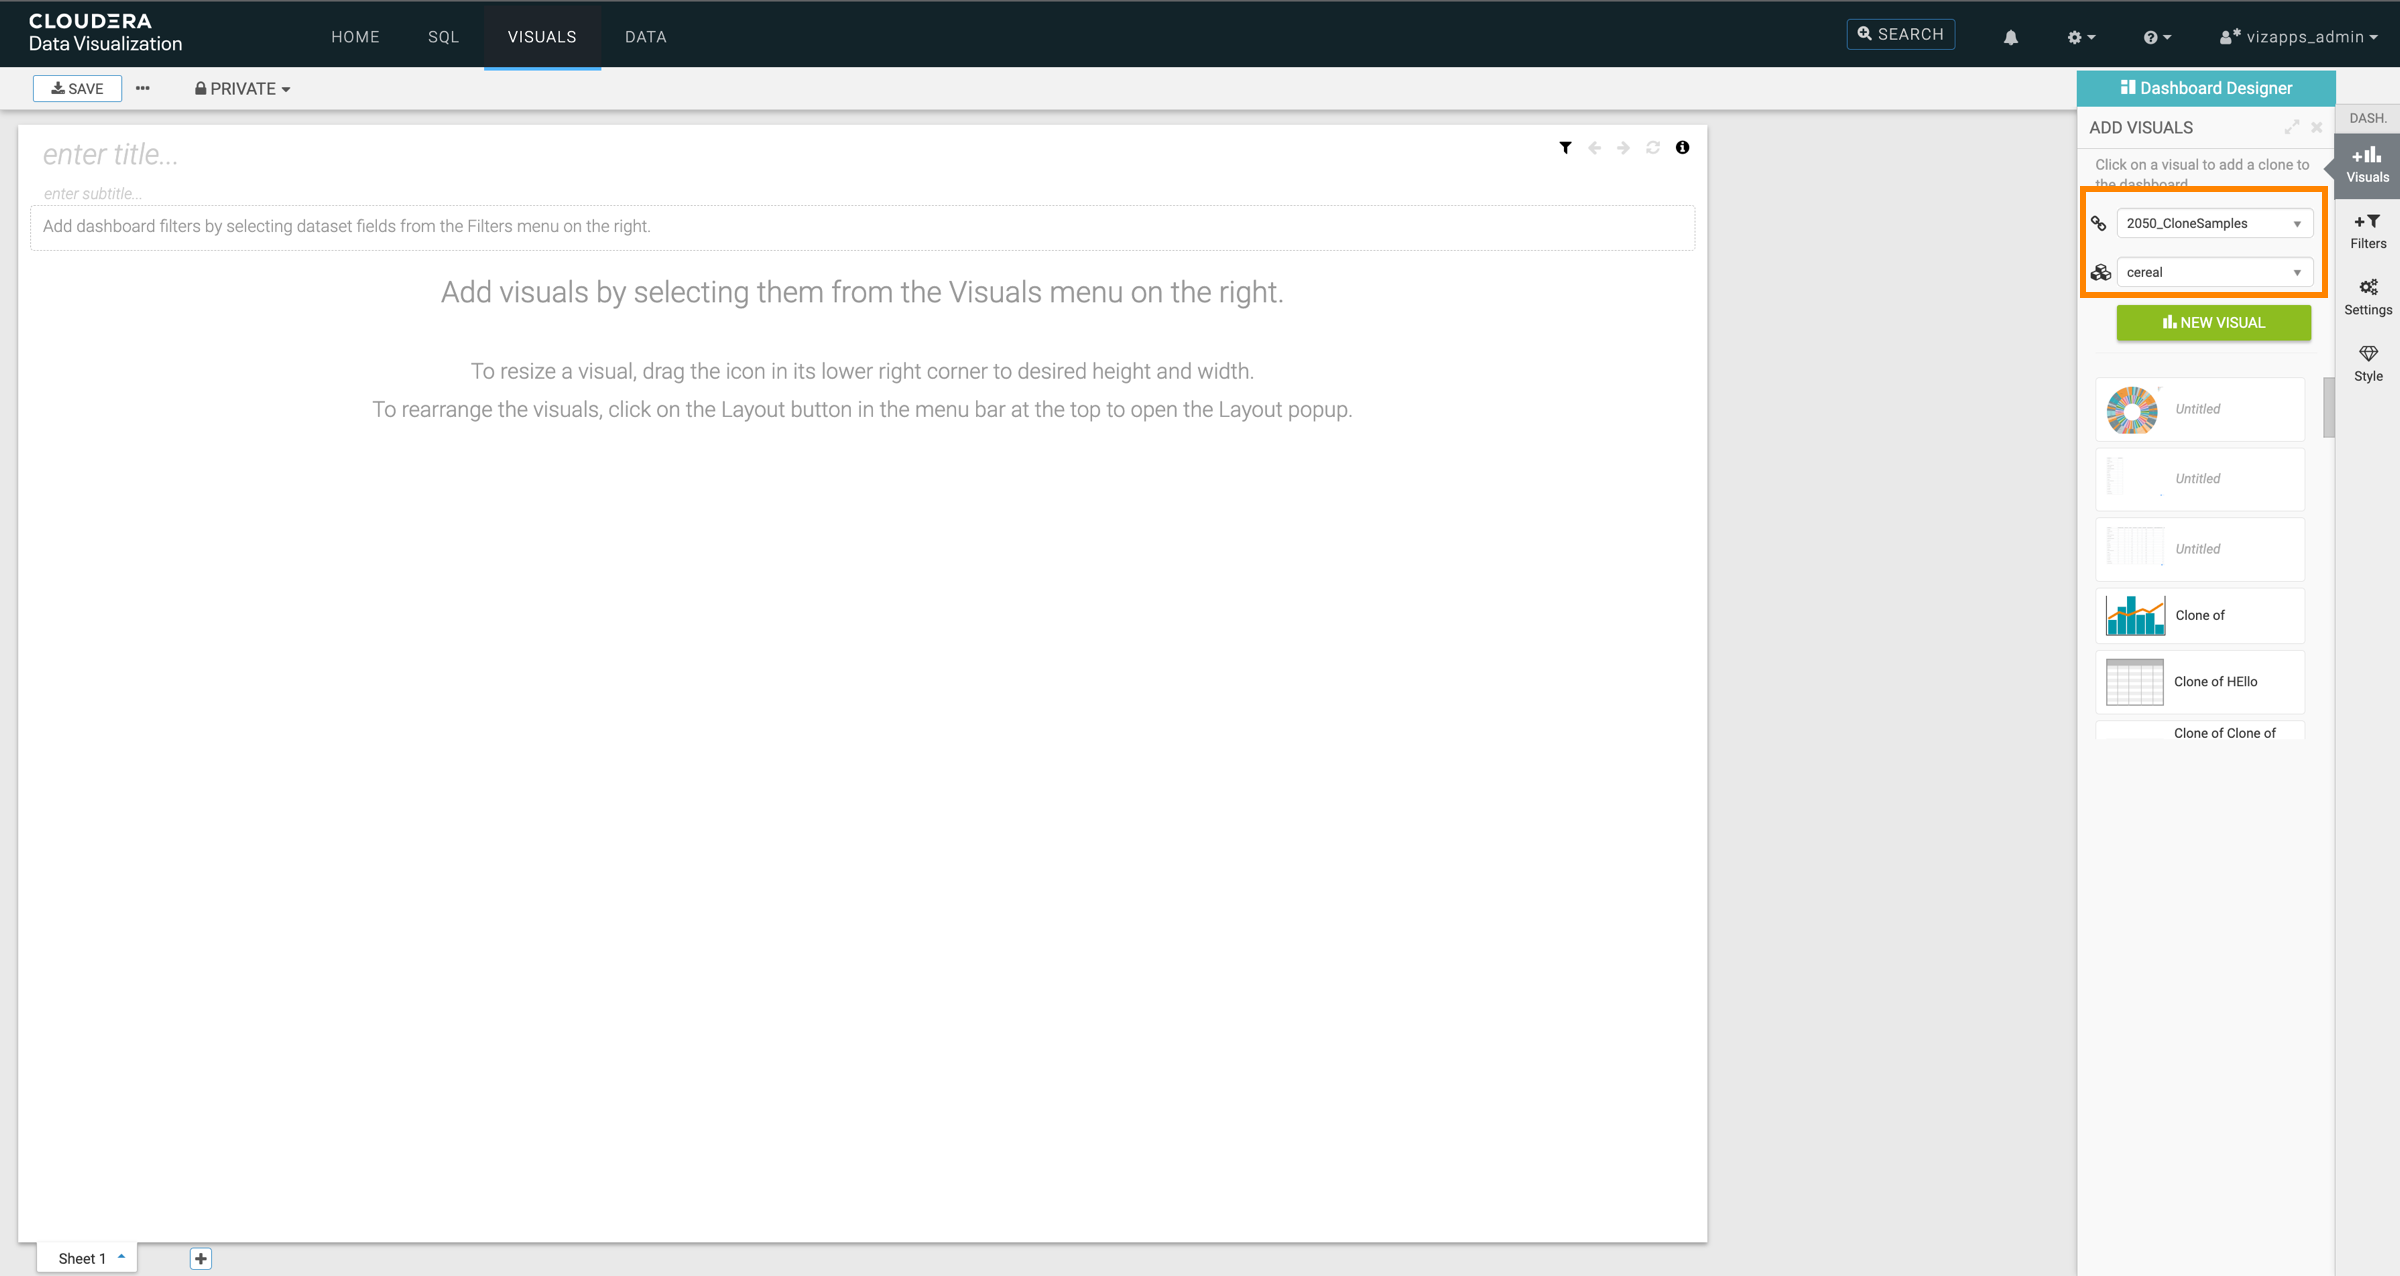
The Dashboard Designer opens and displays a new, untitled dashboard. For an overview of the interface and its components, see the Dashboard Designer documentation.
- Optional:
Change the connection and/or the dataset.
The dashboard is automatically connected to the parent connection and dataset from which it was created. However, you can add visuals and filters based on other connections or datasets.
-
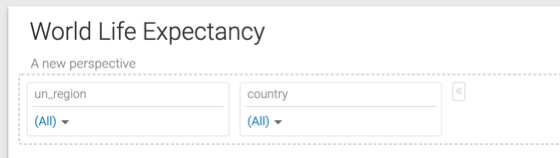
Add a title for the dashboard.
If the Enforce dashboard titles site setting is enabled, a title must be provided before you can save the dashboard. For more information about configuring this site setting, see Managing dashboard site settings.
Optionally, you can also add a subtitle.
In this example, World Life Expectancy and A new perspective are used as title and subtitle.