When a dashboard contains multiple visuals, you may want to resize or reorganize them
to improve usability and presentation. In Cloudera Data Visualization, you can easily
update the layout of a dashboard using the Layout tool.
By default, visuals are positioned sequentially in the
order in which you add them to the dashboard. You can reorganize the layout by resizing
and repositioning individual visuals.You must have the required permissions for the dashboard to
access the Edit action for it.
Open the dashboard you wish to modify in Edit mode.
From the Dashboard Designer top menu bar, click
LAYOUT.
The Layout of Dashboard Visuals modal is
displayed.
Each visual is represented by a widget in the layout dialog. The
widgets provide the following information:
Dataset indicators:
Colored squares in the top-left corner represent the datasets
associated with each visual.
Visual titles:
The title of each visual appears at the top of its widget.
Thumbnails:
Visual snapshots appear as thumbnails, making it easier to
identify each visual.
To reorganize visuals on the canvas, click and drag the widgets to the desired
positions.
To resize a visual, click and drag its bottom-right corner and set the desired
dimensions.
Once you are satisfied with the new arrangement, click APPLY
LAYOUT.
The dashboard layout is updated. The following examples
illustrate how the dashboard changes during the layout customization process.
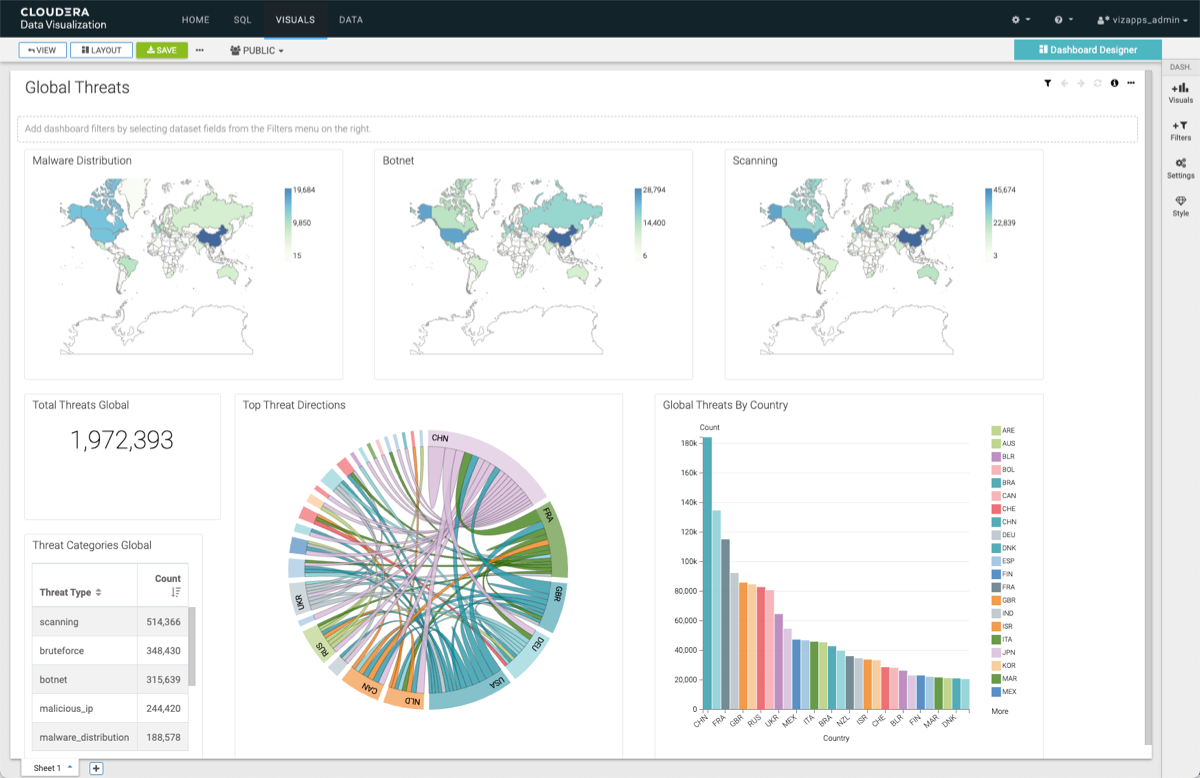
This is the original dashboard, showing the initial arrangement of the
visuals:
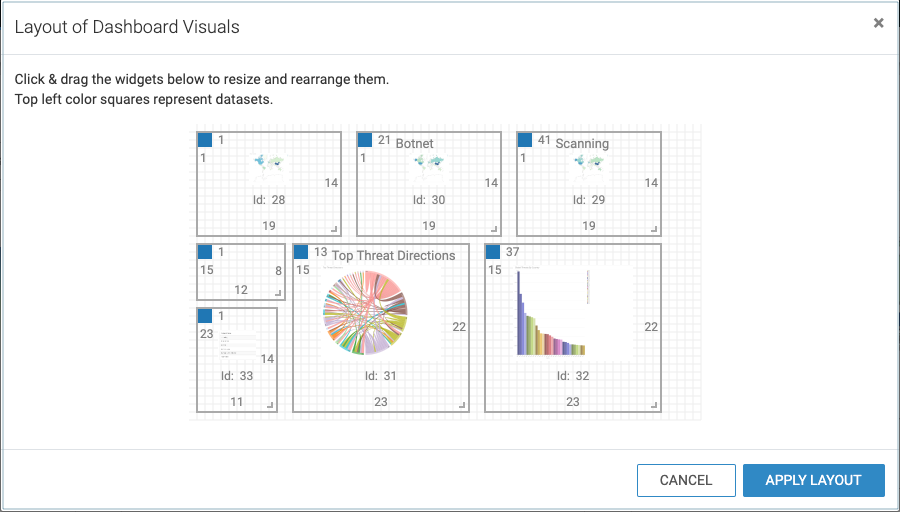
This is the layout modal of the original dashboard:
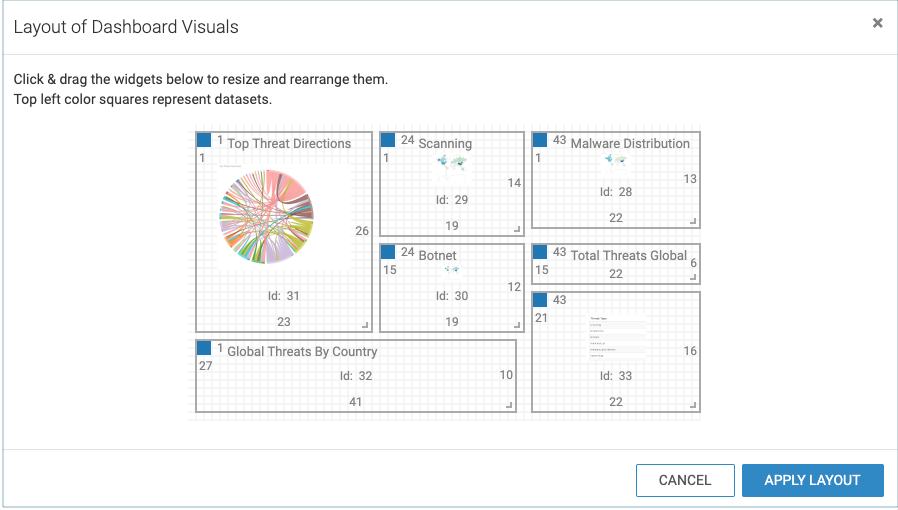
This is the new dashboard layout after rearranging and resizing the widgets
representing the visuals in the dashboard:
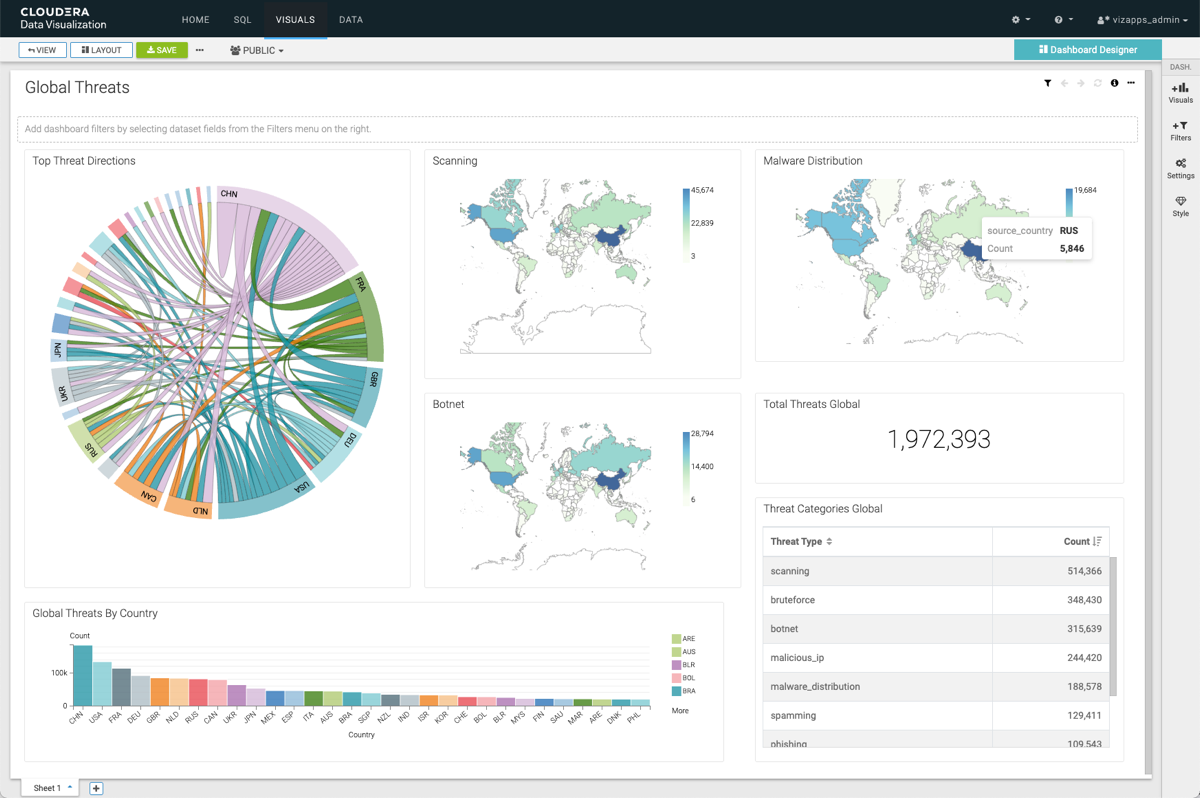
This is the updated dashboard after applying the layout changes: