Refreshing visuals manually in dashboards
Cloudera Data Visualization allows you to control when dashboard visuals are loaded and refreshed. This can improve performance when working with slow or remote data sources, dashboards with many visuals, or dashboards that use complex or resource-intensive queries.
When Refresh visuals manually is enabled:
- Dashboards in View mode do not load visuals automatically.
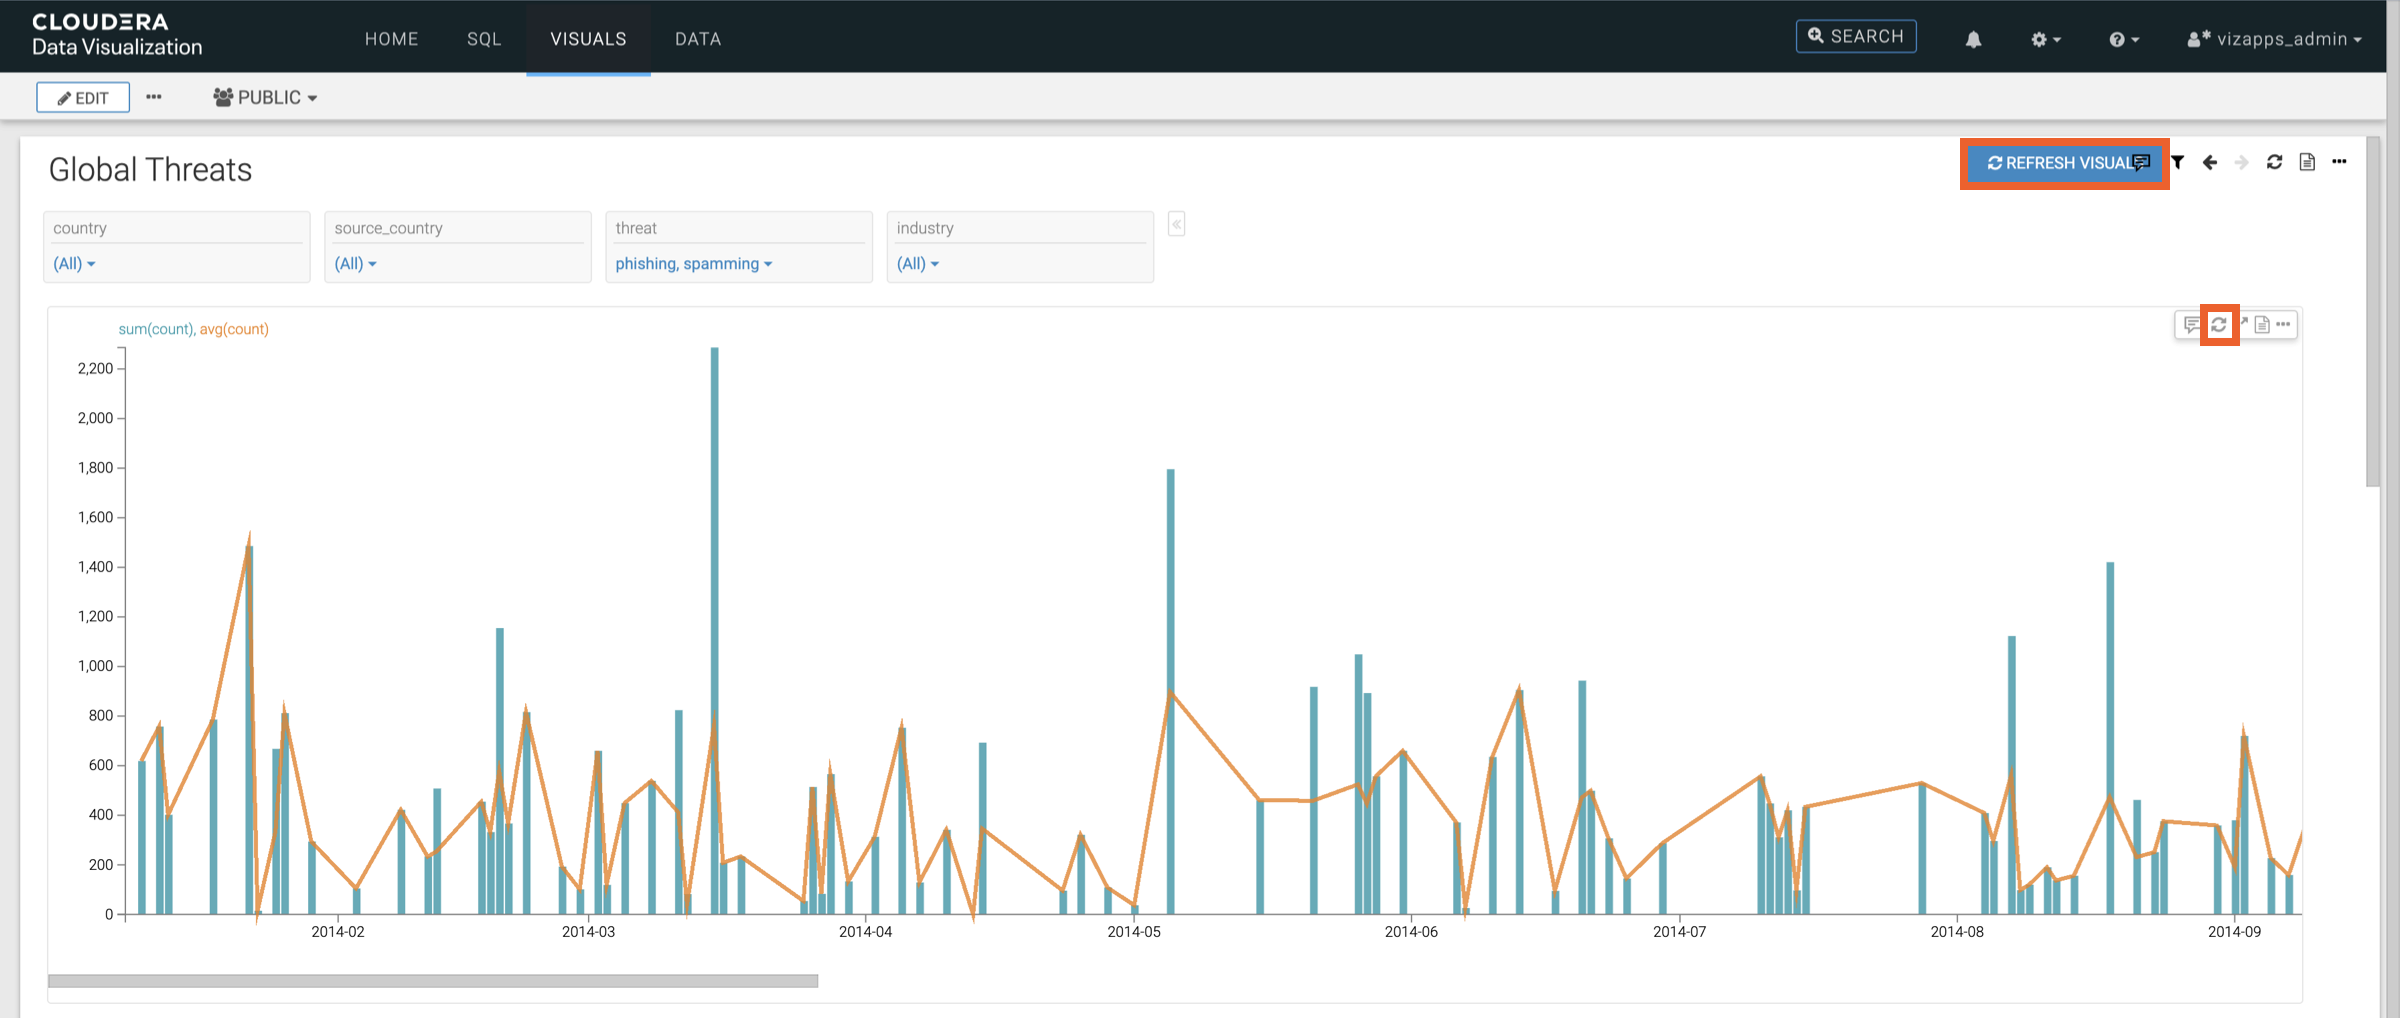
- A REFRESH VISUALS button appears in the top-right corner of the dashboard.
- Each visual displays its own refresh icon.
This allows you to configure filters before running queries and load visuals only when needed. Refreshing individual visuals manually can help reduce system load, especially for dashboards that contain many visuals or run complex queries.
-
Select Refresh visuals manually.

-
Click SAVE.
When this option is enabled:
- Dashboards in View mode do not load visuals automatically.
- A REFRESH VISUALS button appears in the top-right corner of the dashboard.
- Each visual displays its own refresh icon (
 ).
).
-
Switch the dashboard to View mode.
Only the filter widget are displayed. When you change a filter, visuals are not refreshed automatically.
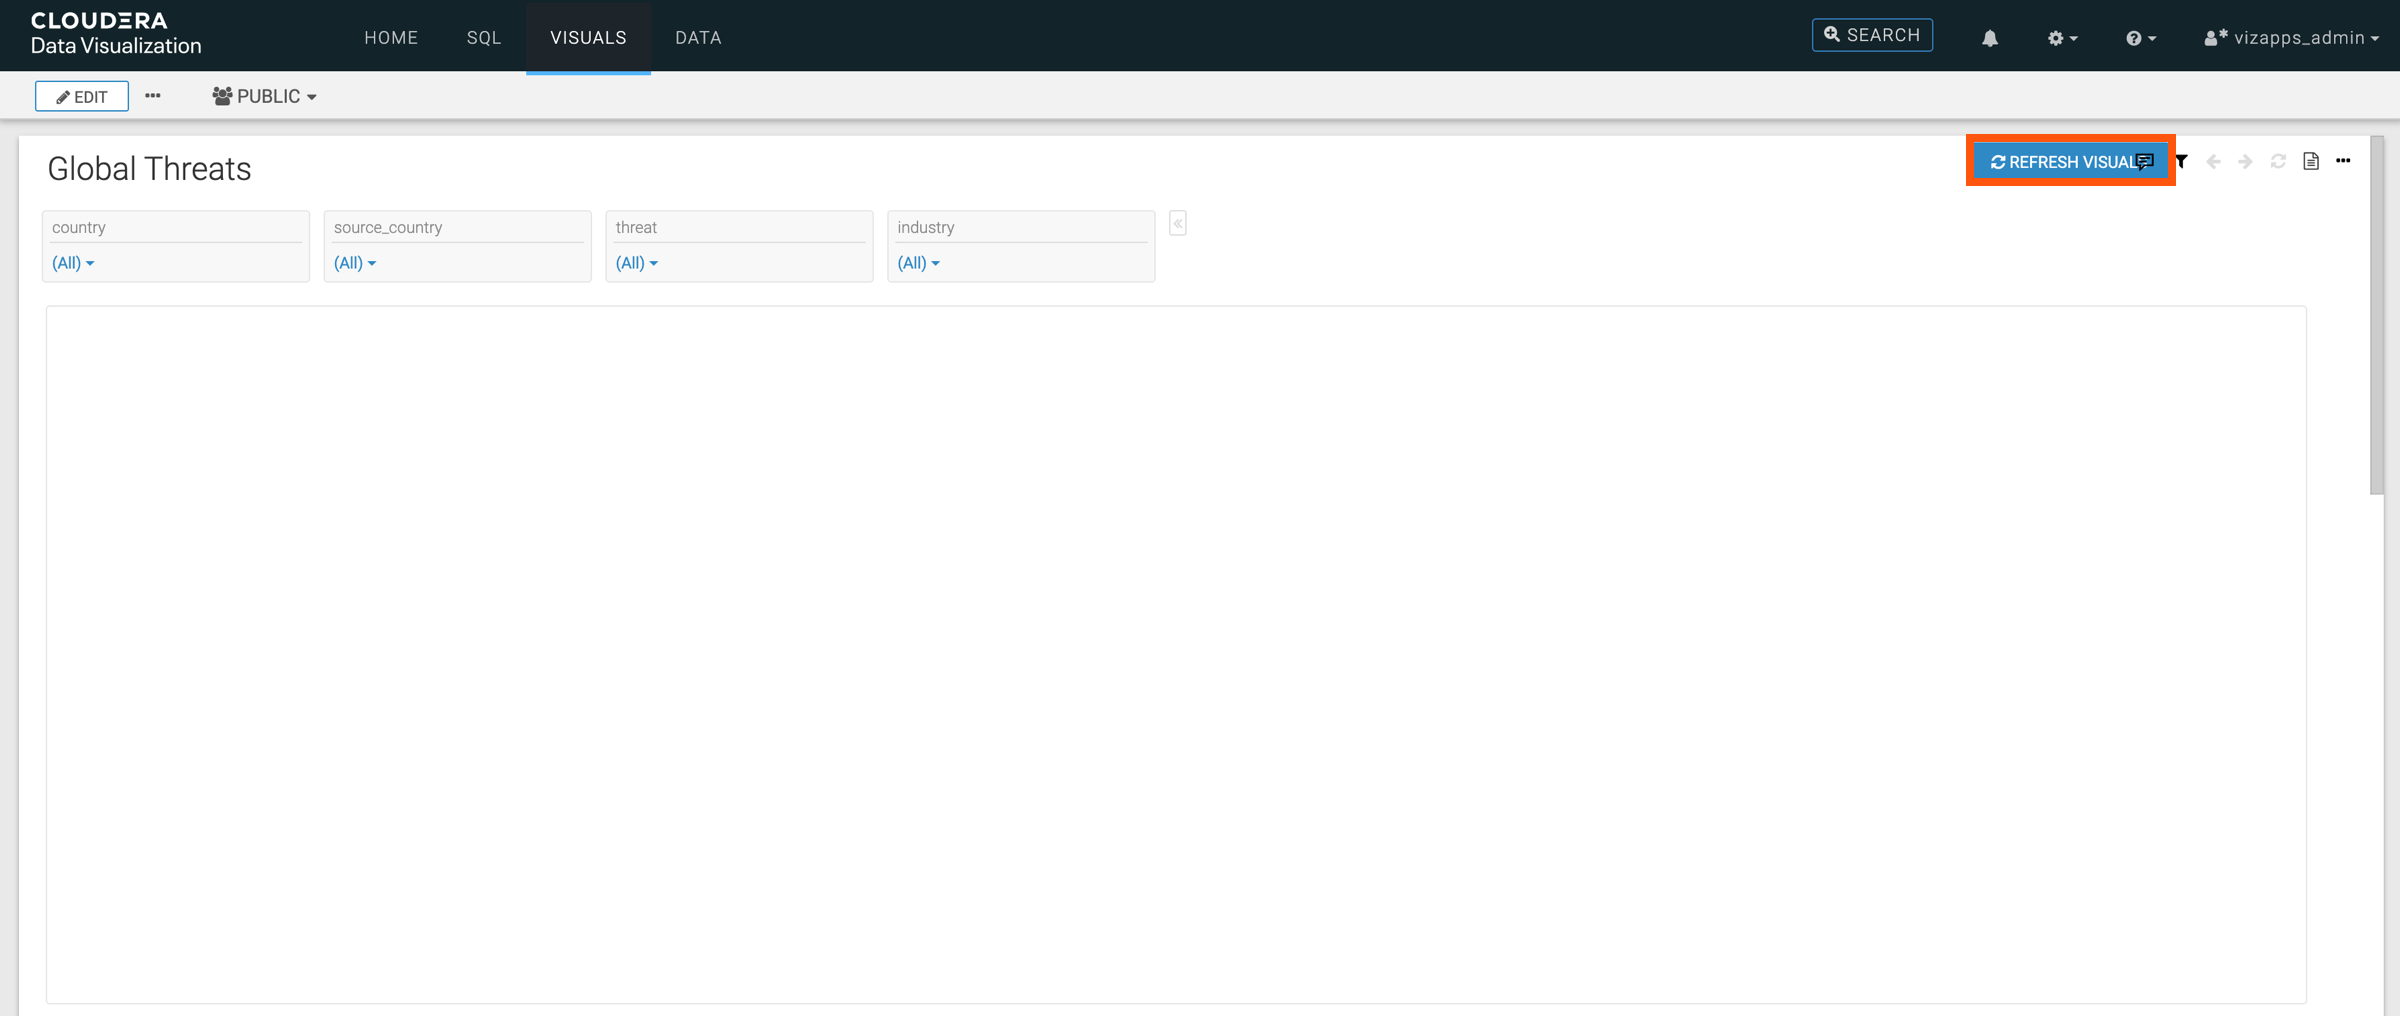
-
Click REFRESH VISUALS to display the visuals of the
dashboard.
The behavior of the refresh actions depends on the dashboard state:
- When the dashboard is opened and visuals have not yet been loaded, clicking REFRESH VISUALS or a visual’s refresh icon loads all visuals.
- After visuals have been loaded, refreshing depends on filter changes:
- If you change a filter and REFRESH VISUALS, only the visuals that use the dataset affected by that filter are refreshed.
- Visuals that use other datasets are not refreshed.