Creating basic combos
Cloudera Data Visualization enables you to create Combined Bar/Line (Combo) visuals.
The following steps demonstrate how to create a new combined bar and line chart .
For an overview of shelves that specify this visual, see Shelves for combos.
-
In the VISUALS menu, find and click Combined
Bar/Line.
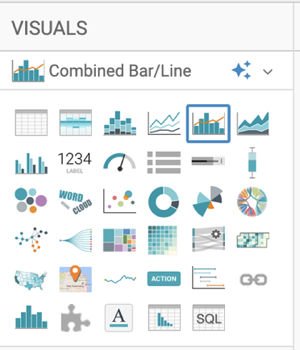
The shelves of the visual changed.
The mandatory shelf for Combined Bar/Line visuals is Dimension that maps to the X-axis.
Bar Measure and Line Measure both map to the Y-axis.
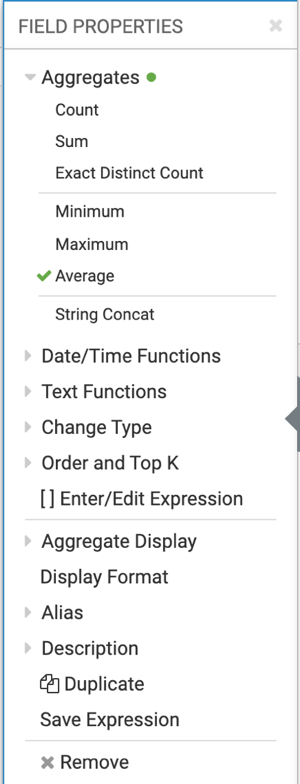
- Change the aggregate of the
life_expectancyfield fromsum(life_expectancy)toavg(life_expectancy):-
Select .
-
Select .
- Similarly, change the aggregate of the
gdp_per_capitafield fromsum(gdp_per_capita)toavg(gdp_per_capita):-
Click the
gdp_per_capitafield to open the FIELD PROPERTIES menu. - Select .
- Click the x icon at the top of the FIELD PROPERTIES menu to close it.
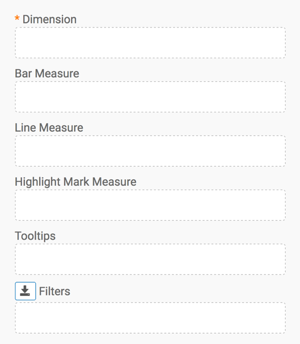
The shelves of your visual should now look similar to the following image: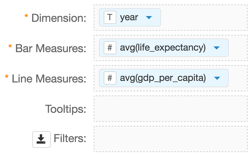
-
Click the
-
Click REFRESH VISUAL.
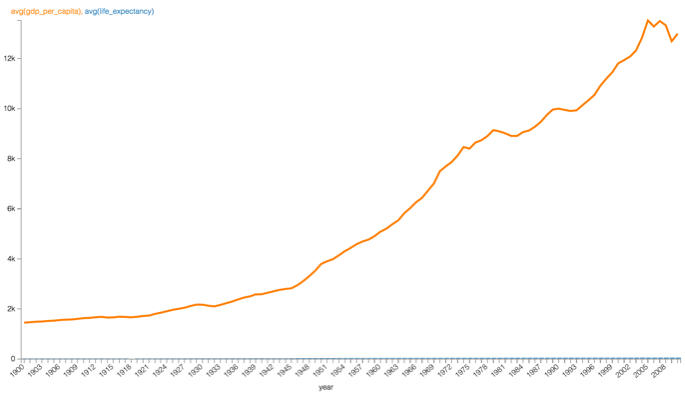
The combined bar and line visual appears.
The two legends for the Y axis match the color of the plot: the orange line represents
sum(gdp_per_capita)and the blue bars representavg(life_expectancy). However, you may not be able to see the bars because the values of that measure are much smaller than the values for the line measure. To see the bars, assign a measure to a secondary axis.