Country map with bubbles
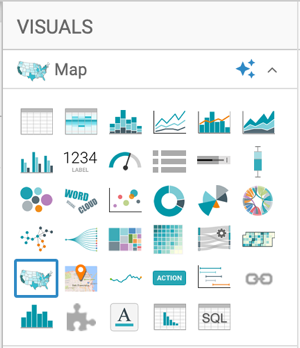
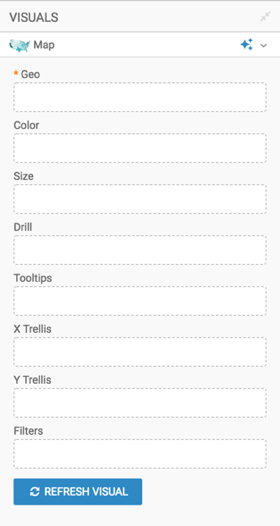
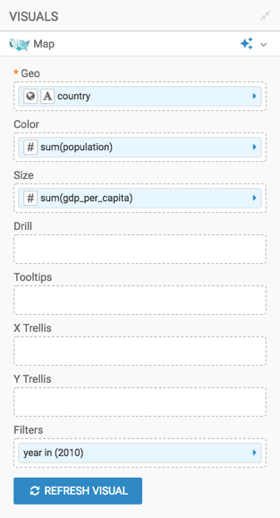
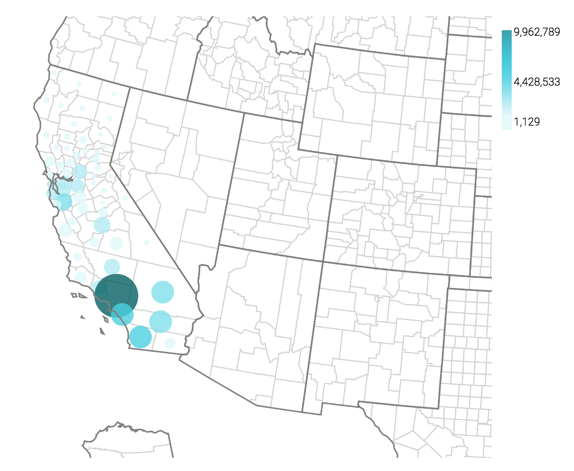
Cloudera Data Visualization Map visuals can use bubbles to show relative measurement values for countries. You can display two measurements at the same time: the first measurement as the color of the bubble, and the second one as the relative size of the bubble.
The following steps demonstrate how to create a new map visual on the dataset World Life
Expectancy [data source samples.world_life_expectancy]. It produces
bubbles with area that corresponds to the relative population in each country.


