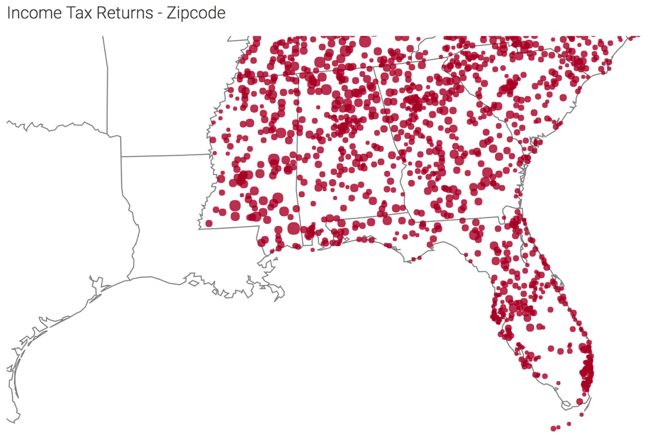
US zipcode map with bubbles
In Cloudera Data Visualization Map visuals, you can plot measurements based on zipcode data. Bubble maps display up to two measurements simultaneously: as the color of the bubble, and as the relative size of the bubble.
A zip code map of the United States shows a comparison of measurement values across US
States. Zipcode maps only work with bubble options. The Income Tax Returns dataset is
used in this example, which is built on the tax_returns.csv datafile that
contains statistical information about Personal Income Tax Returns for 2016
(zip_tax_returns_2016.csv), summarized by zipcode.


