Cloudera Data Visualization, SQL view
The SQL page allows you to create and run SQL queries against your connected data sources. You can use SQL queries to explore data, validate results, and create new datasets.
The SQL page is typically the starting point when you need to explore raw data or create custom datasets for analysis and visualization.
Use the SQL area to:
- Write SQL statements
- Browse available databases, tables, and columns
- Run queries and review results
- Save queries for future use
- Create datasets from query results
- Create dashboards based on query output
The SQL page contains the following main elements:
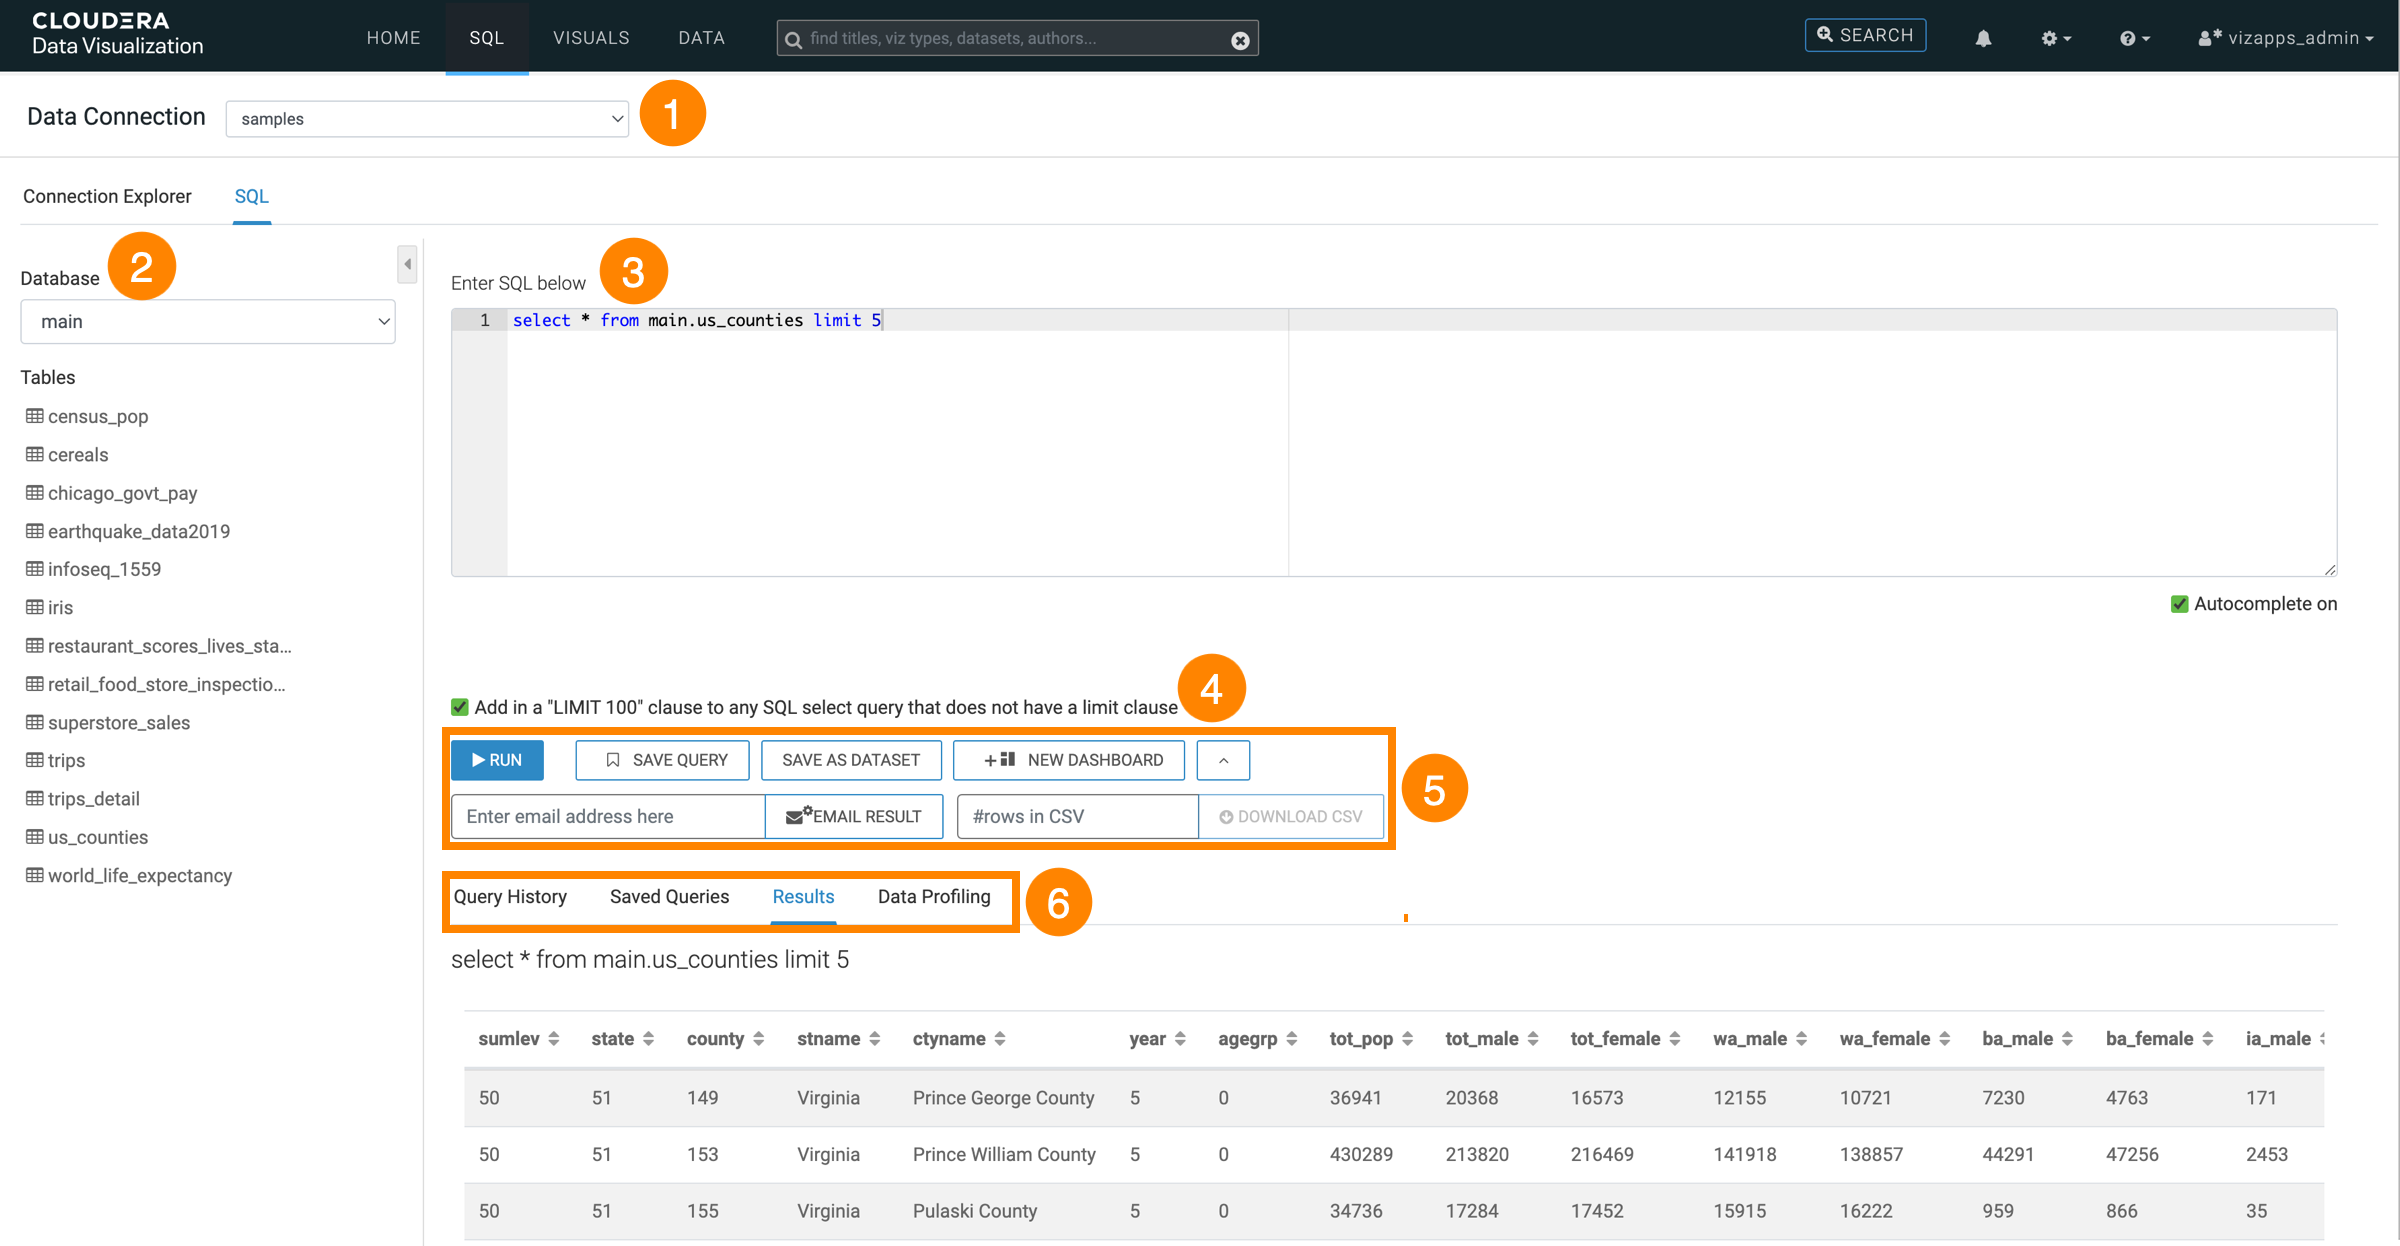
- Main elements
-
- Data Connection – Select the data source against which you want to run queries.
- Database – Select a database from the chosen data connection. Available tables are displayed for the selected database.
- SQL editor textbox – Enter and edit SQL statements.
- LIMIT 100 clause – Automate the addition of a LIMIT 100 clause to your SQL SELECT queries when a limit is not specified in the query to retrieve a maximum of 100 rows from the database.
- 5. Actions
-
- RUN – Click this button to run the SQL query that you have added. It allows you to quickly test and view query results. When clicked, it fetches the requested data from the dataset and displays the result in the Results tab.
- SAVE QUERY – Save the current SQL query to the Saved Queries tab for later use. Saved queries are especially useful when you need to repeatedly run the same query or when collaborating with others who may need to refer to the query later.
- SAVE AS DATASET – Save the output of the current query as a new dataset. Instead of only saving the SQL statement, this option preserves the resulting data, creating a customized dataset. This way you can preserve a specific subset of the data that can be analyzed, profiled, or visualized in the platform without needing to rerun the original query.
- NEW DASHBOARD – Create a dashboard based on the current query output. A dashboard may contain visualizations, charts, or summary statistics that provide insights into the data.
- Enter email address here – Enter one or more email addresses. It is used in conjunction with the EMAIL RESULT button, enabling users to send query results directly to specified email addresses. You can share query outputs with colleagues or stakeholders without having them access the interface directly.
- EMAIL RESULT – Send the results of the query to the specified address.
- #rows in CSV – Add a number to this field to specify the number of rows to be included in the CSV file when downloading the results. You can limit the data exported, which is useful when dealing with large datasets. For example, you might want to export only the first 1000 rows instead of the full dataset to reduce file size or focus on a sample.
- DOWNLOAD CSV – Download query results as a CSV file. You can specify the number of rows to include before downloading.
- 6. Display tabs
-
- Query History – Shows the list of past queries and their details.
- Saved Queries – Shows the queries saved for future use.
- Results – Shows the data returned by the query in a tabular format.
- Data Profiling – Provides statistical summaries and insights about query results. For more information, see Working with data profiling .