Creating visuals with optional dimensions
-
Open a new dashboard.
-
Click New Visual.
-
Select the World Life Expectancy dataset in the Data
menu.
-
Select the Table visual type in the
Visuals menu.
-
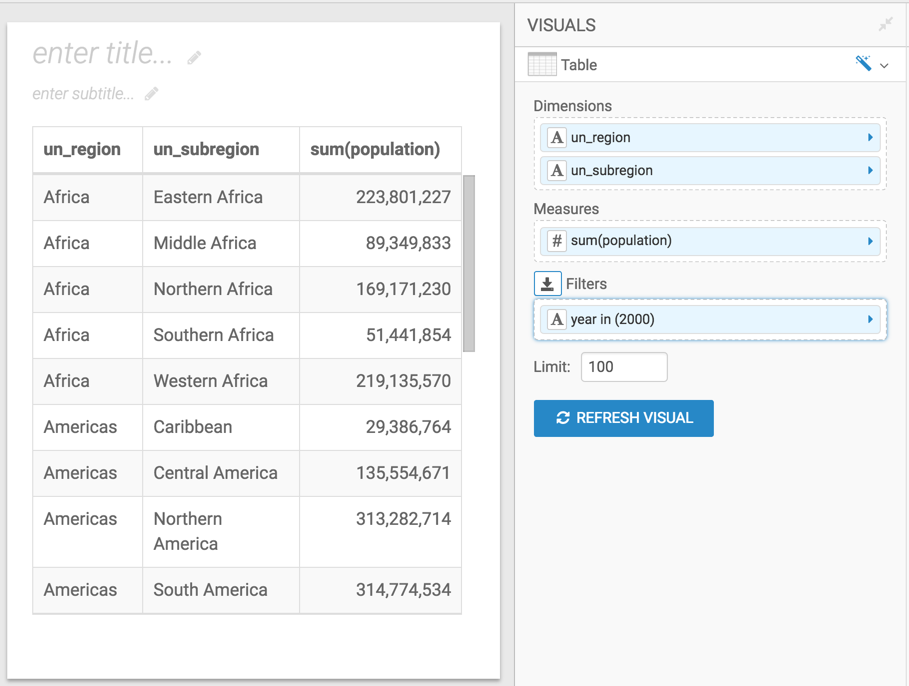
Populate the shelves of the visual:
- From Dimension, select and move
un_region and
un_subregion fields onto the Dimension
shelf.
- From Measures, select and move
population
field onto the Measures shelf.
- From Dimensions, select and move
year field
onto the Filters shelf.
- On the Filters shelf, select
year field,
choose Pick values from a list, select 2000,
and click SAVE.
-
From Dimensions, select and move the
country
field to the Dimension shelf.
-
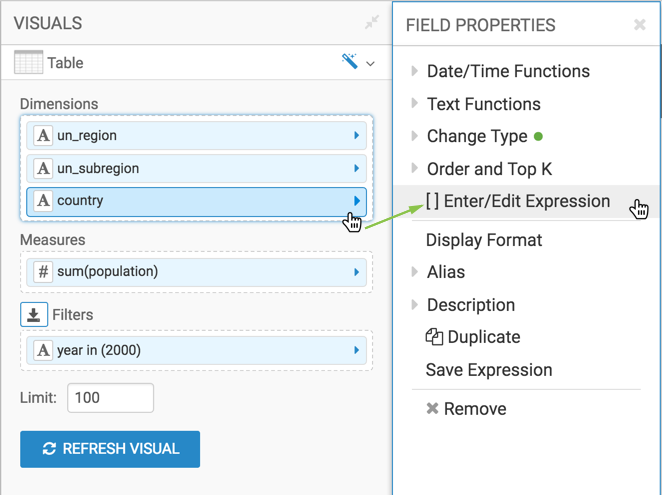
On the Dimensions shelf, click
country
field.
-
In the FIELD PROPERTIES menu, select [ ] Enter/Edit
Expression.
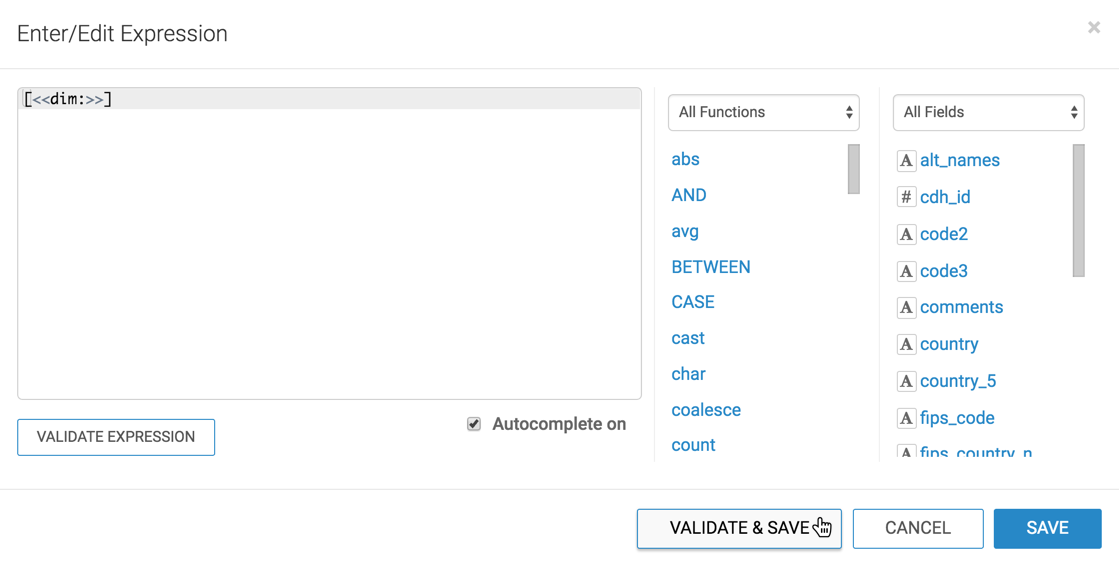
-
In the Enter/Edit Expression modal window, change the text to
the following expression:
[<<dim:>>]
-
Click VALIDATE & SAVE.
-
Click REFRESH VISUAL.
-
Change the name of the visual to Regional Populations.
-
Click SAVE.