Verifying access restriction on a visual
After configuring row-level access with filter associations, verify that users can see only the data permitted by their assigned segments. You can do this by viewing the same visual as different users and comparing the results.
The following example demonstrates how row-level access affects data visibility in a visual showing U.S. state populations over time.
- Administrative user
-
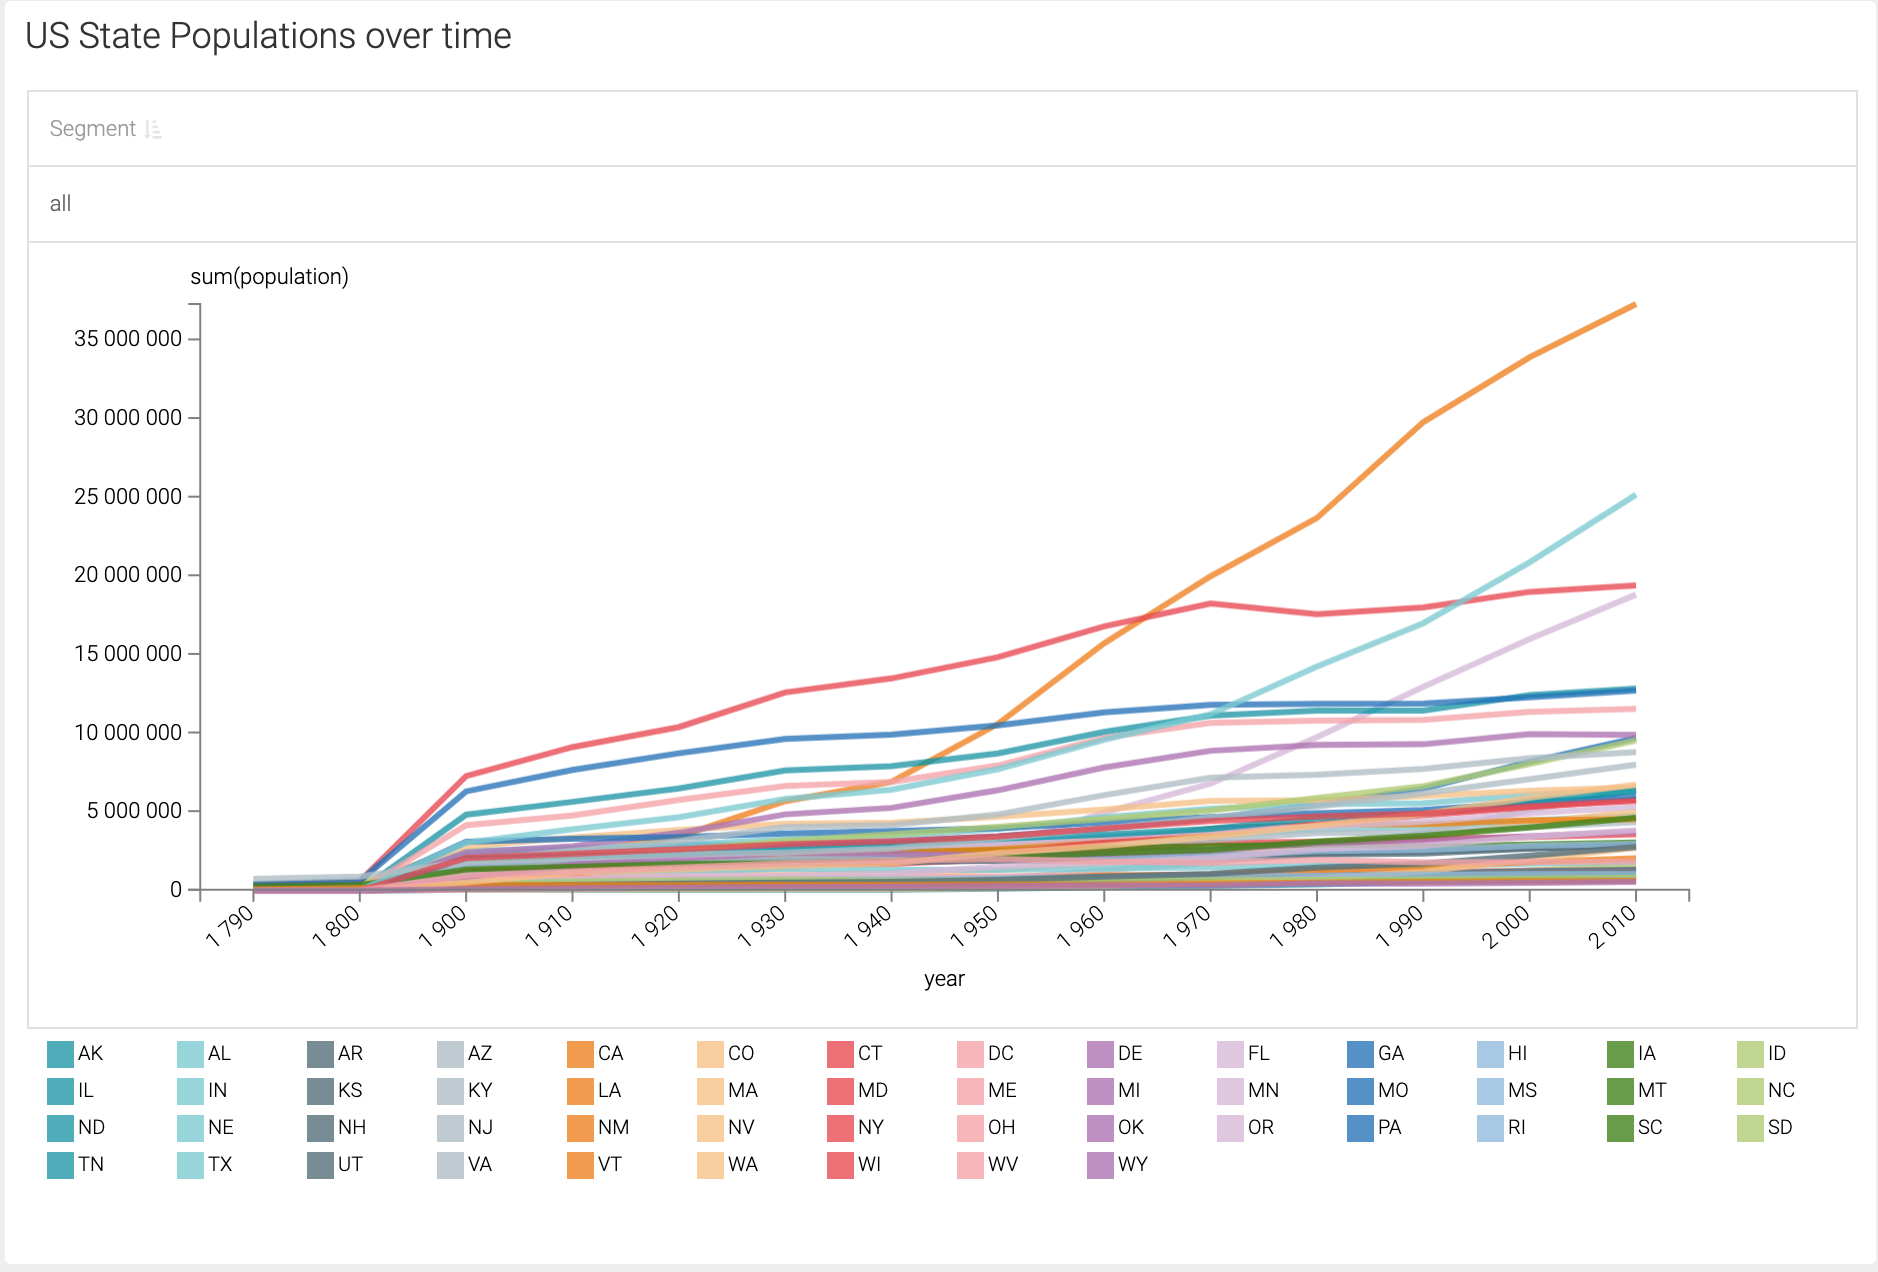
When logged in as an administrator, the visual displays population data for all states across all regions.
- User associated with a single-region segment
-
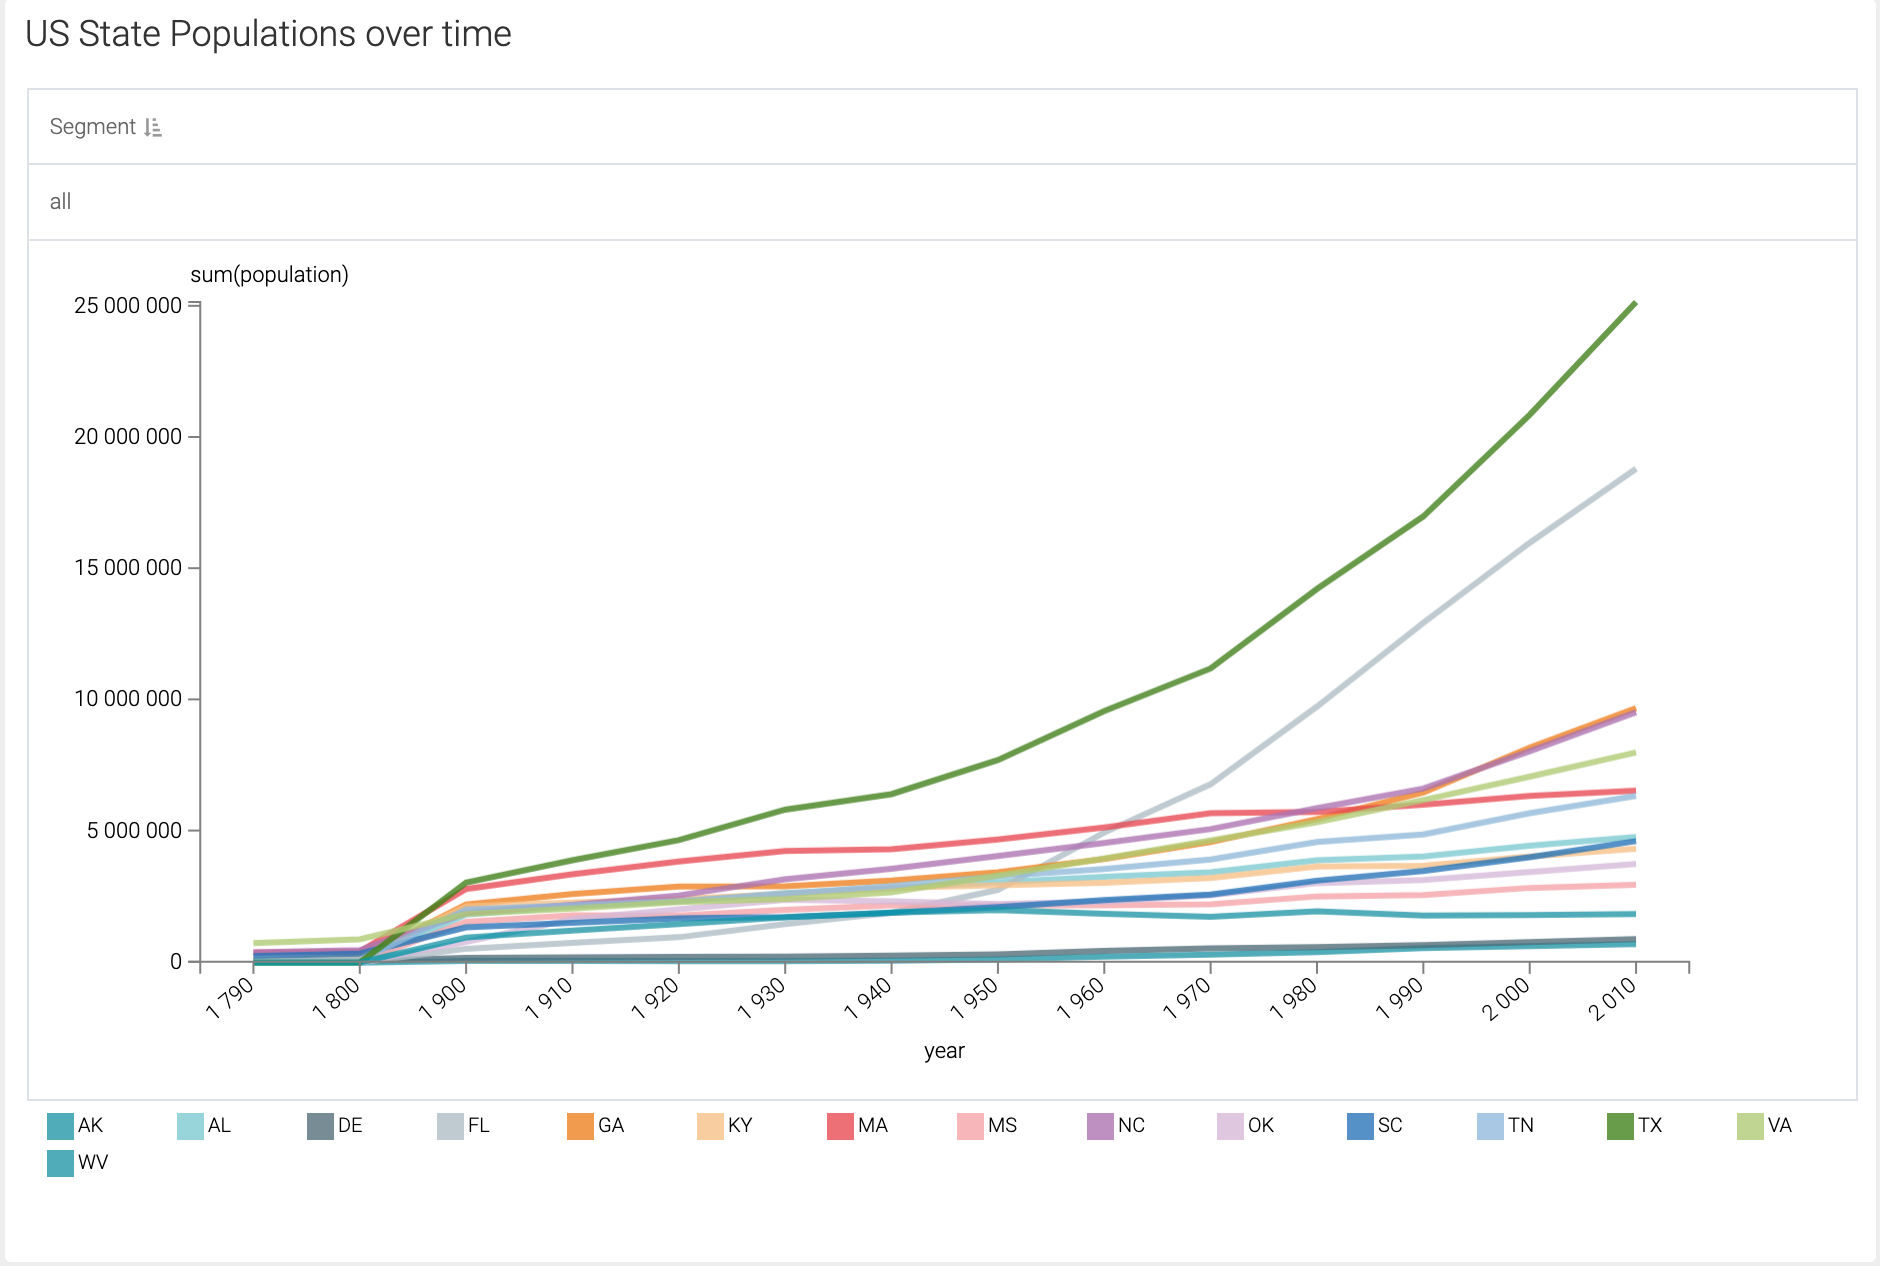
When logged in as Analyst_4, who associated with the Midwest regional segment, the visual displays data included in that segment (for states in the midwest area).
- User associated with a different single-region segment
-
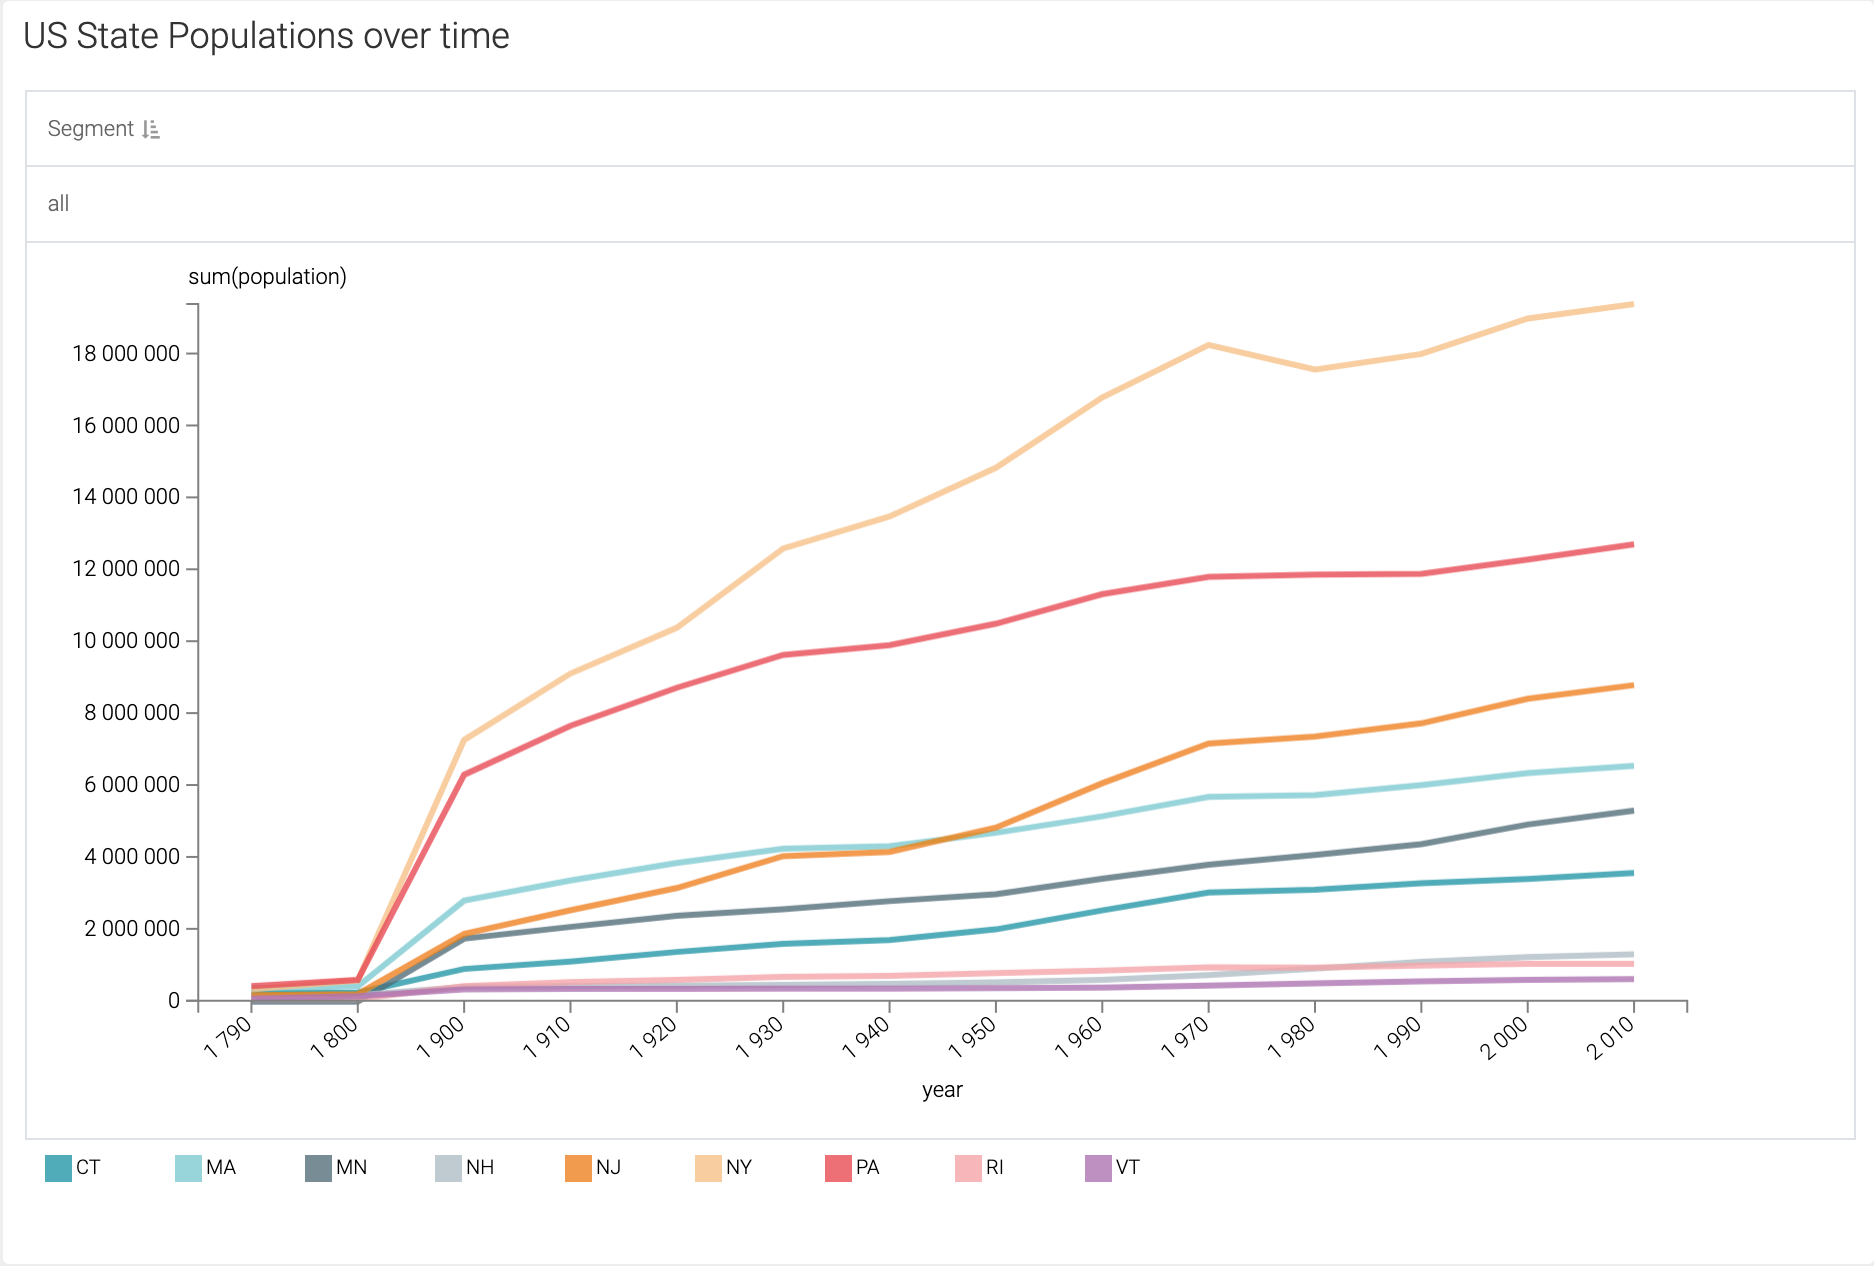
When logged in as Analyst_2, who is associated with another regional segment called South, the visual displays data accordingly, showing only the data relevant to that segment (records for states in the south), with no visibility into other regions.