You can create a visual directly from selected fields on the Dataset
Profiling tab. You can either add the visual to an existing dashboard or create a
new dashboard for it.
Data profiling has been completed for the selected fields.
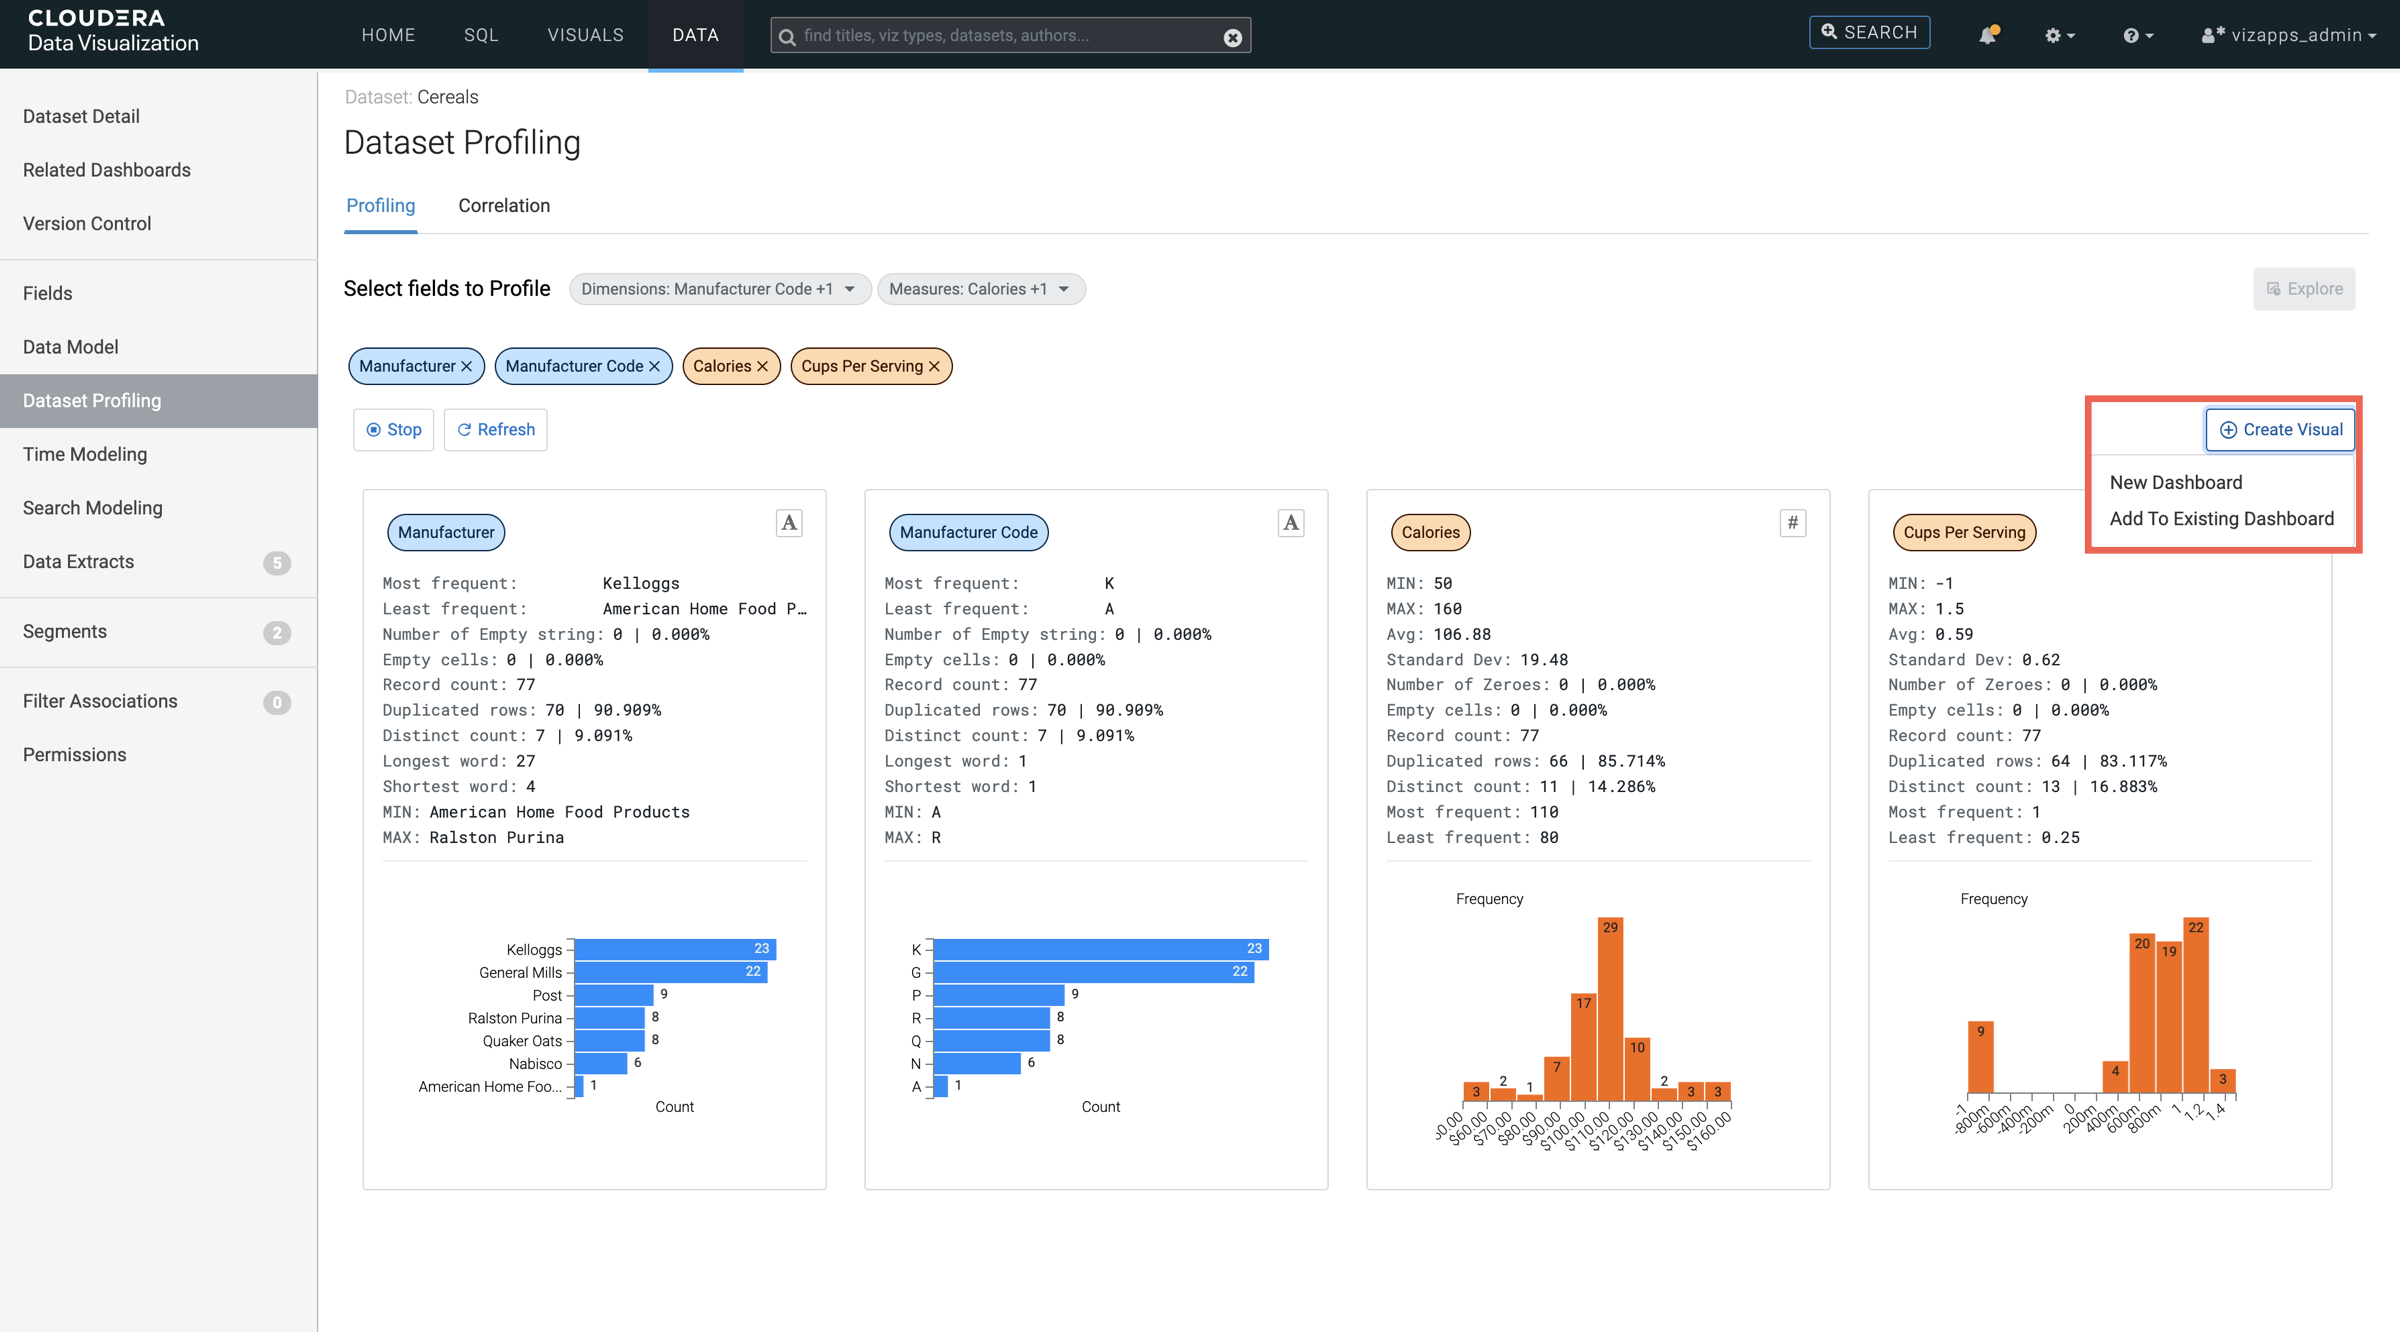
Click Create Visual.
Choose whether to add the visual to an existing dashboard or create a new one.
The Create Visual & Dashboard modal is displayed.
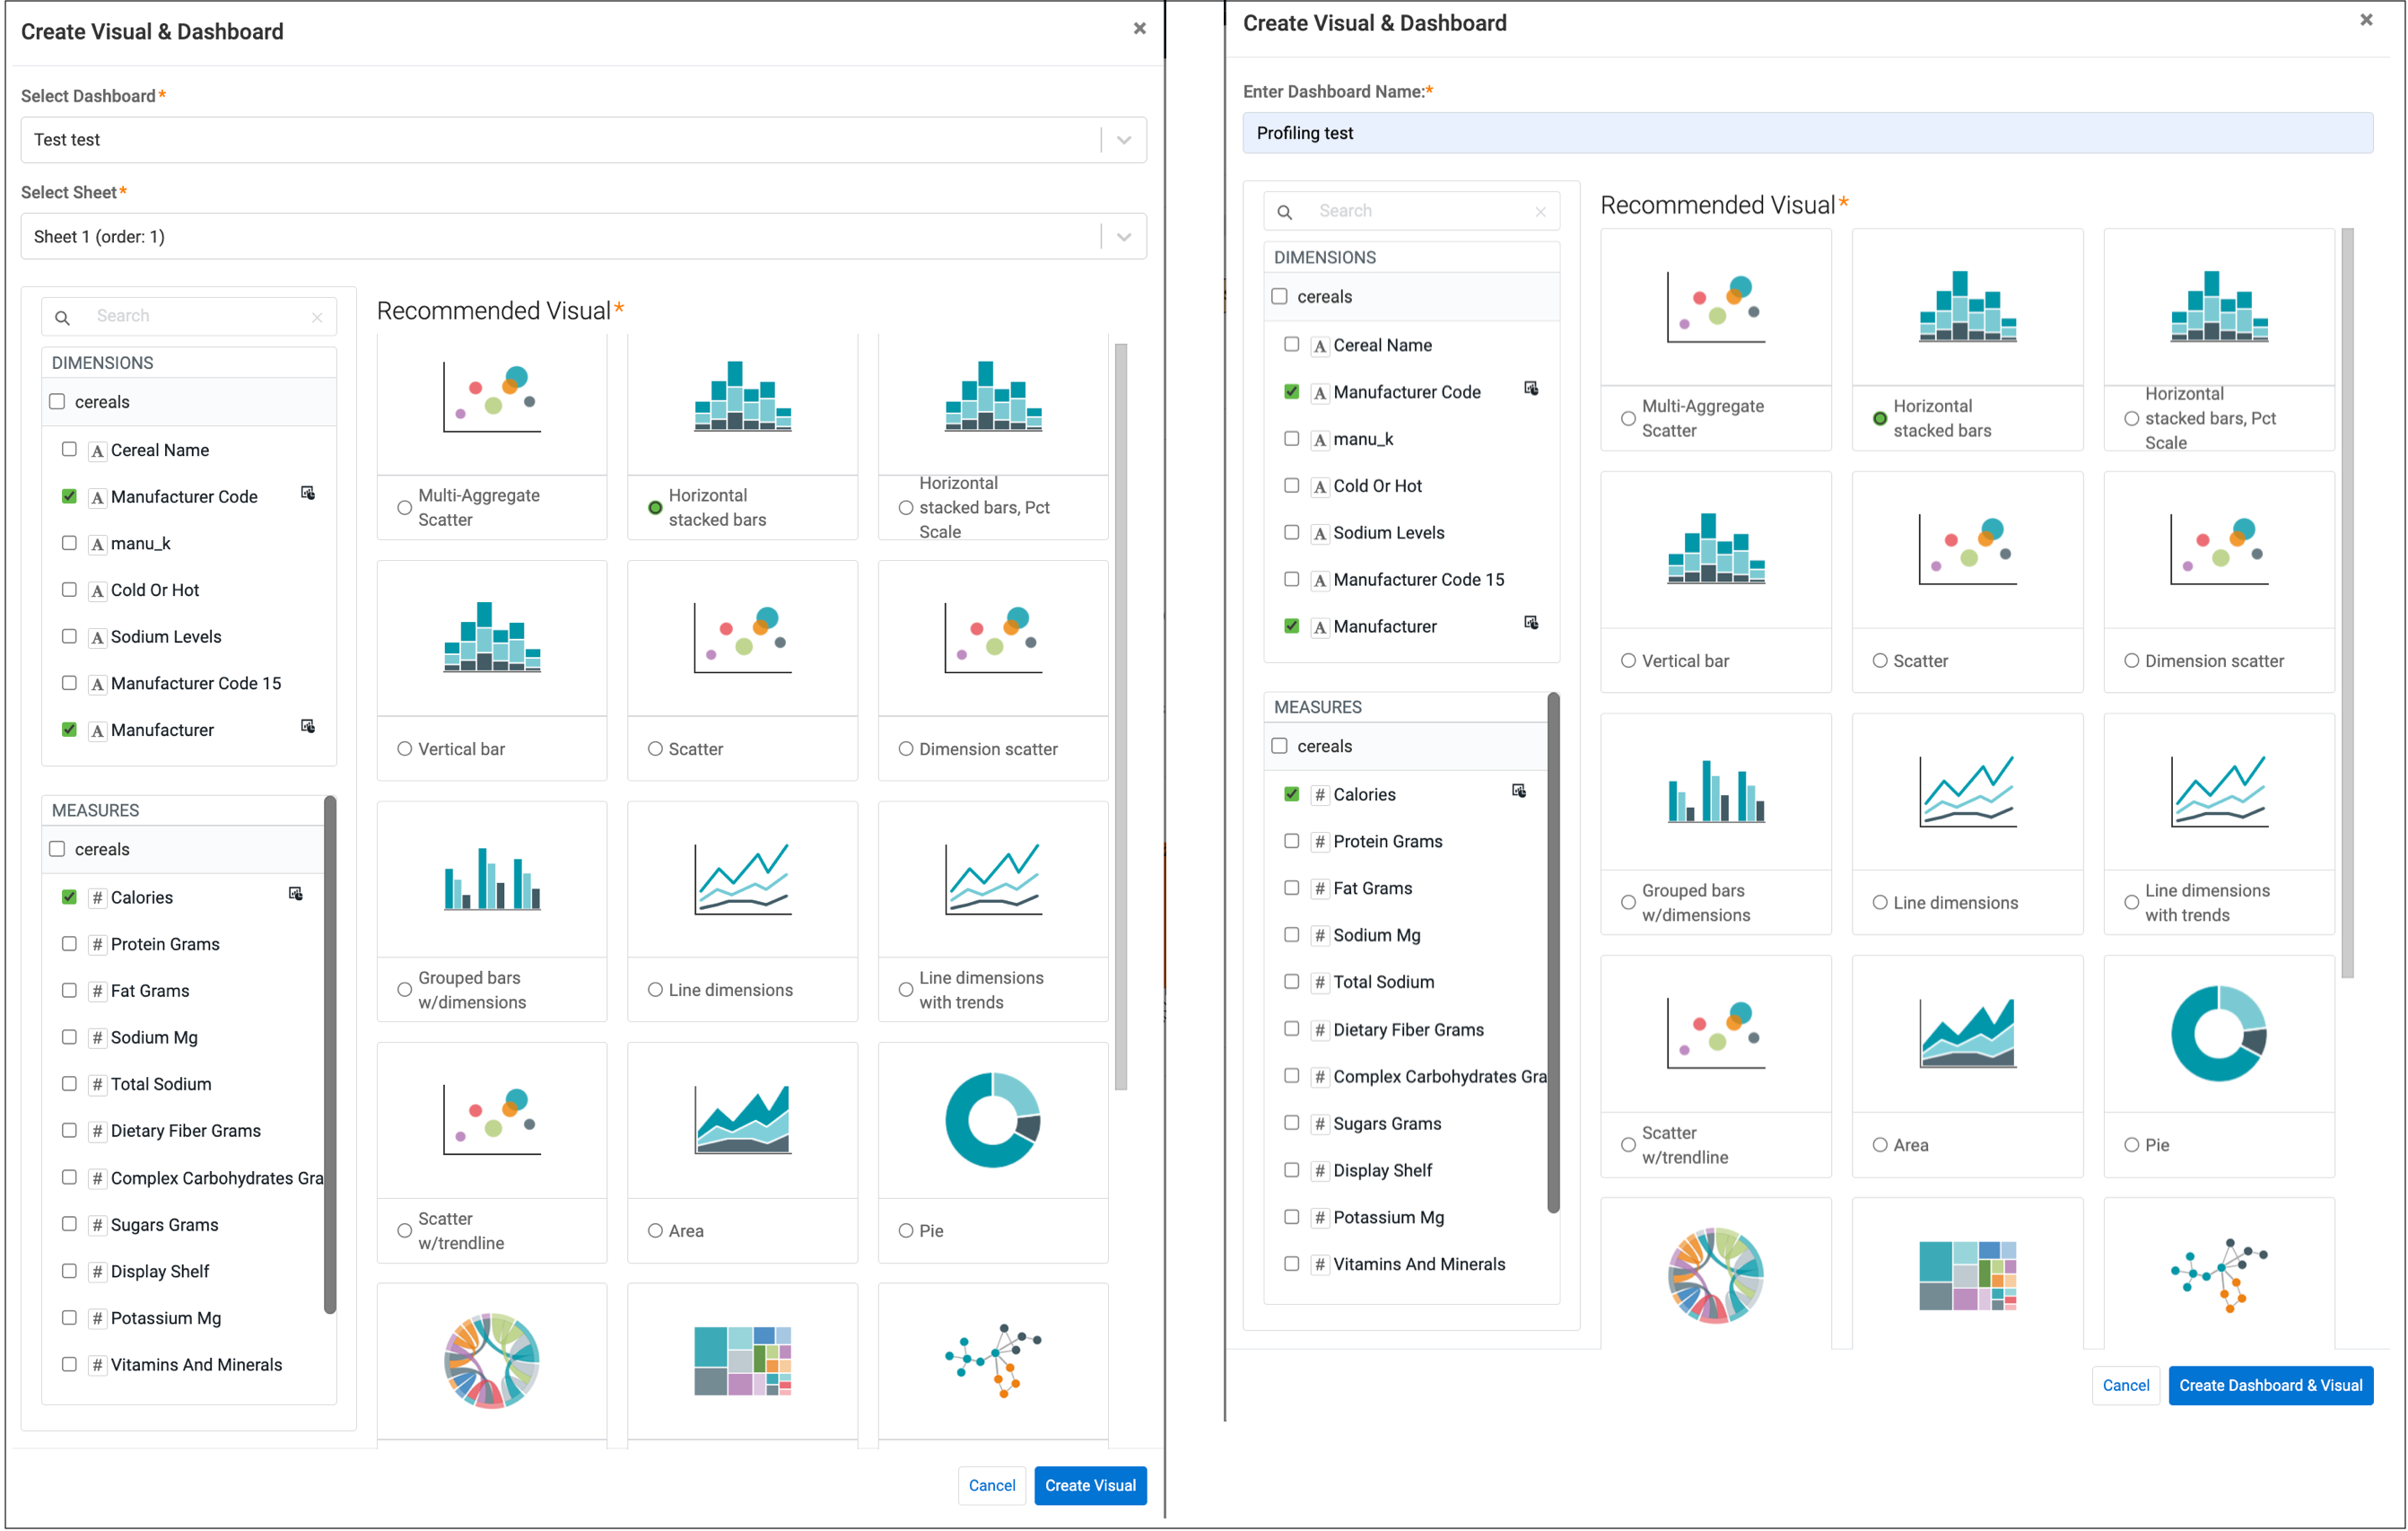
If you are adding the visual to an existing dashboard, select the dashboard and sheet
from the dropdown menus.
If you are creating a new dashboard, enter a name for it.
Optional: Modify the preselected dimension and measure fields that will be used for building the
visual.
Select a visual type.
Click Create Visual or Create Dashboard &
Visual depending on your selection.