Using profiling
The Profiling tab provides statistics and visualizations for selected fields in a dataset. You can explore dimensions and measures, view data types, refresh results, and manage cards to better understand the dataset.
Enable data profiling in . For more information, see Managing data-related site settings.
-
Select the fields that you want to examine and click
Explore.
Cards appear with statistics and visualizations for each selected field. If the query is running too long, you can cancel it by clicking Stop. You can rerun a query and get updated results by clicking Refresh.
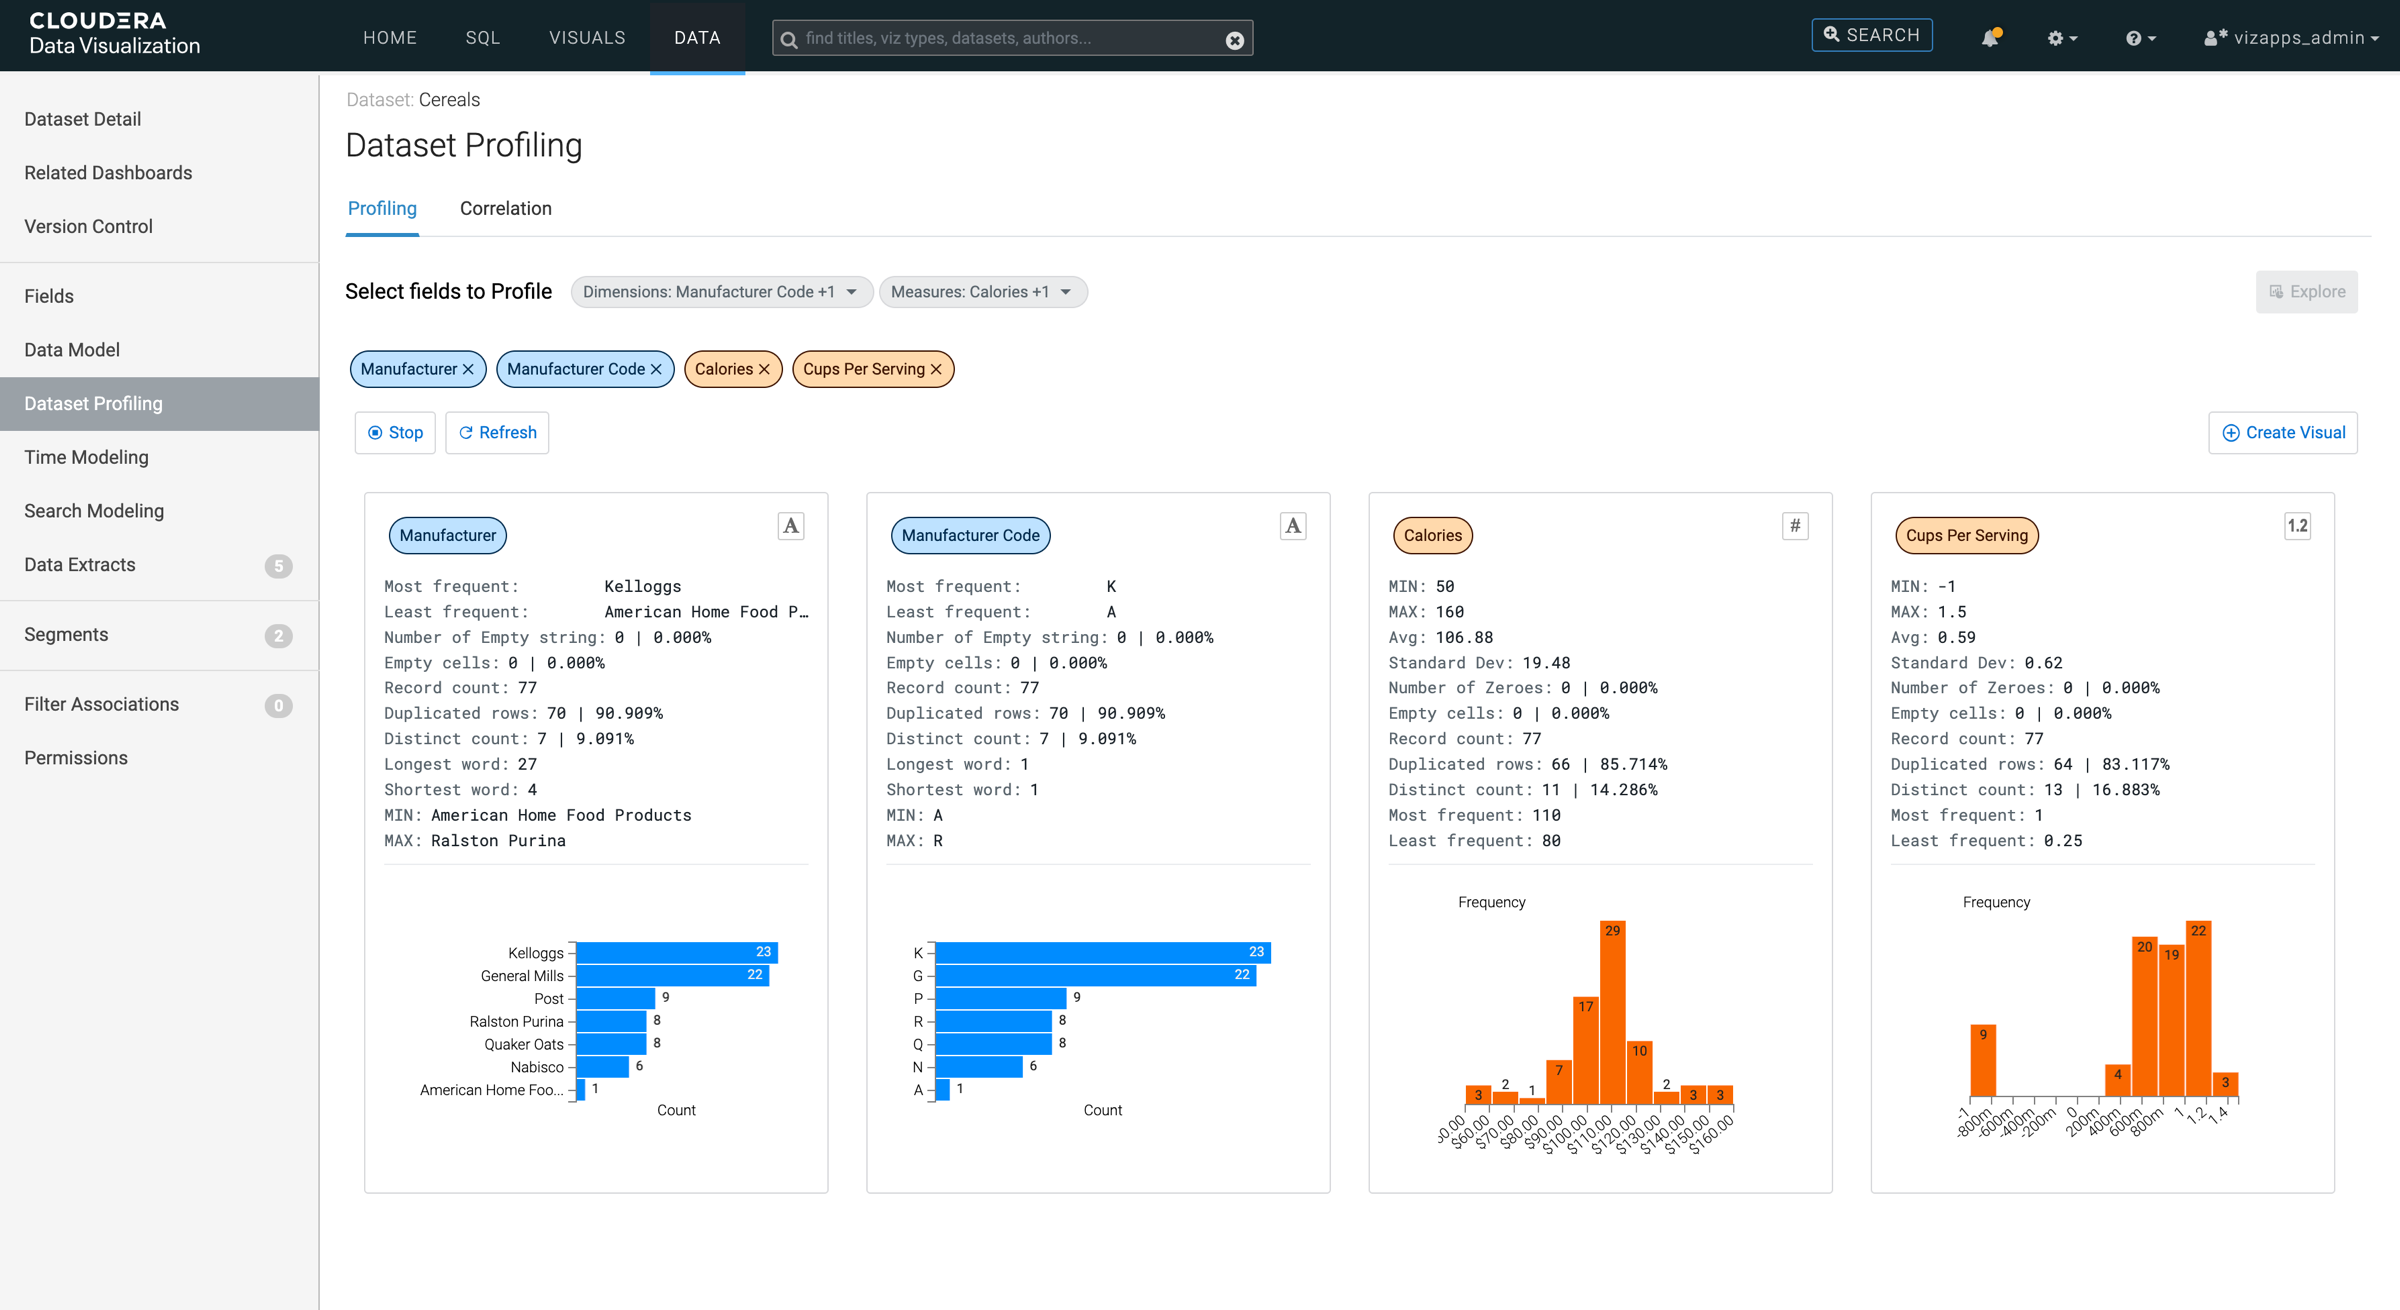
The following information is shown for the selected dataset fields.
Dimension values:- Most frequent
- The string that appears the most often in the dataset, helping to identify the most common value.
- Least frequent
- The string that appears the least often in the dataset, helping to identify rare or unusual values.
- Number of Empty string
- The count of cells that contain an empty string, for example cells that are not null but contain no characters.
- Empty cells
- The number of cells that are completely empty, including both null values and empty strings.
- Record count
- The total number of records in the dataset.
- Duplicated rows
- The number of rows that are exactly identical, helping to identify redundant data. A high number of duplicates often signifies low variability in the dataset.
- Distinct count
- The number of unique values in the dataset, showing how varied the data is.
- Longest word
- The string with the highest number of characters in the dataset, providing insight into the potential size of values.
- Shortest word
- The string with the fewest number of characters, indicating the shortest data entry.
- MIN
- The minimum value in the dataset based on alphabetical order, useful for sorting or range analysis.
- MAX
- The maximum value in the dataset based on alphabetical order, helping to define the upper range of the data.
The count histogram for dimensions shows how many times each category appears, that is the number of occurrences (counts) of each category (dimension). This visualization is useful for understanding the quality, distribution, and structure of your dataset.
Measure values:- MIN
- The smallest numeric value in the dataset, showing the lower bound of your data.
- MAX
- The largest numeric value in the dataset, showing the upper bound of your data.
- Avg (Average)
- The sum of all numeric values divided by the total number of records, giving an overall sense of the central value.
- Standard Dev
- Standard deviation that shows how spread out the numbers are in the dataset. A higher value indicates more variability in the data and a lower value indicates that the data points are closer to the average.
- Number of Zeroes
- The count of records where the value is exactly zero, indicating gaps or null-equivalents in the data.
- Empty cells
- The number of cells that are completely empty, including both null values and missing values.
- Record count
- The total number of records in the dataset.
- Duplicated rows
- The number of rows where all values are identical, helping to identify redundant data. A high number of duplicates often signifies low variability in the dataset.
- Distinct count
- The number of unique values in the dataset, showing how varied the data is.
- Most frequent
- The numeric value that appears the most often in the dataset, helping to identify the most common value.
- Least frequent
- The numeric value that appears the least often in the dataset, helping to identify rare or unusual values.