Viewing a compaction alert using Grafana
Learn how to access Grafana dashboards from Cloudera Data Warehouse (CDW) to view compaction alerts and take necessary actions to keep your cluster healthy. Alternatively, you can also access Grafana from the Management Console.
You can also access the Grafana dashboards from the Management Console by going to the Dashboard page and clicking Monitoring Dashboard.
Perform the following steps to access Grafana from CDW:
-
Click
 and locate an environment having a Database Catalog
you activated for Cloudera Data Warehouse (CDW).
and locate an environment having a Database Catalog
you activated for Cloudera Data Warehouse (CDW).
-
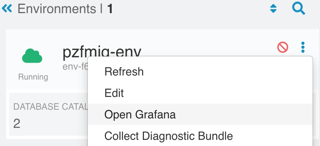
Click the environment options
 and select Open
Grafana.
and select Open
Grafana.
-
In the Grafana web interface, click
 and then select
Dashboards.
A list of dashboard groups is displayed.
and then select
Dashboards.
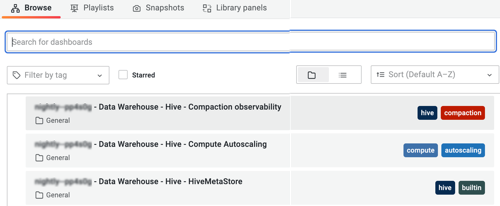
A list of dashboard groups is displayed. -
Locate and click the <Environment Name>- Data Warehouse - Hive - Compaction
observability dashboard group to view all the dashboards related
to Hive compactions.