OpenTelemetry Impala query tracing example
Learn how to use Jaeger to visualize the telemetry data from a simple Impala query.
After configuring OpenTelemetry support for your Impala Virtual Warehouse, you can view detailed telemetry data for your queries in a trace visualization system like Jaeger. The following steps show a typical workflow for finding and analyzing a query trace.
Finding a query trace
- On the Jaeger UI, use the search function to find traces. You can filter by service,
such as Impalad, or other tags like the query ID. The search results provide a high-level
summary of the traces found.
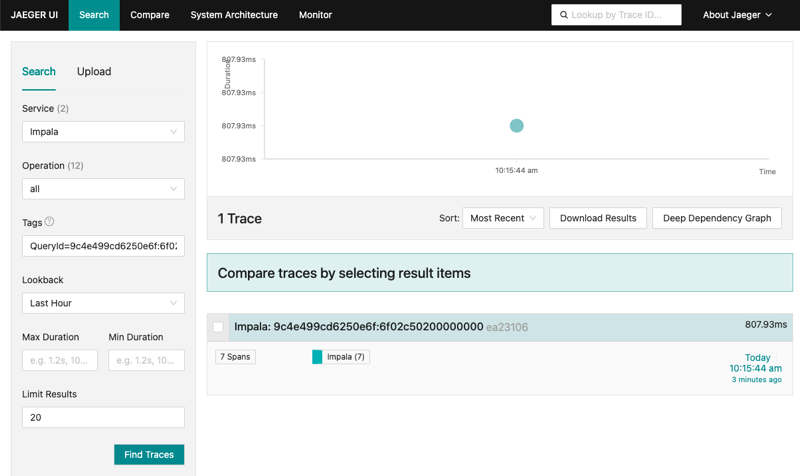
- From the search results, select a specific trace to view its summary and timeline.
Understanding the query trace timeline
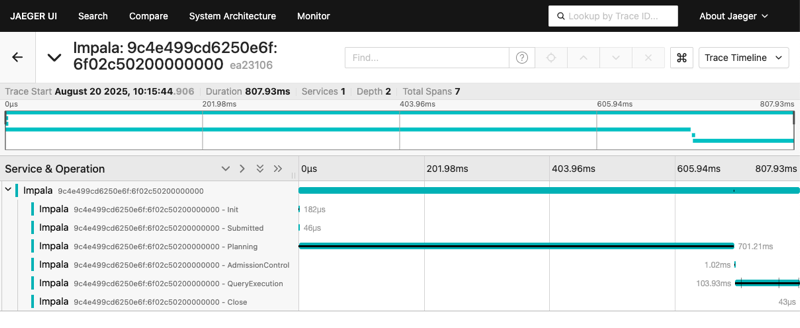
A trace provides a detailed breakdown of a query execution from start to finish. Each segment in the timeline is a span, representing a specific operation. The main query is represented by a root span, and its various stages are shown as child spans.
The following image shows the full timeline of a simple query, with a breakdown of its core stages.
Analyzing child spans
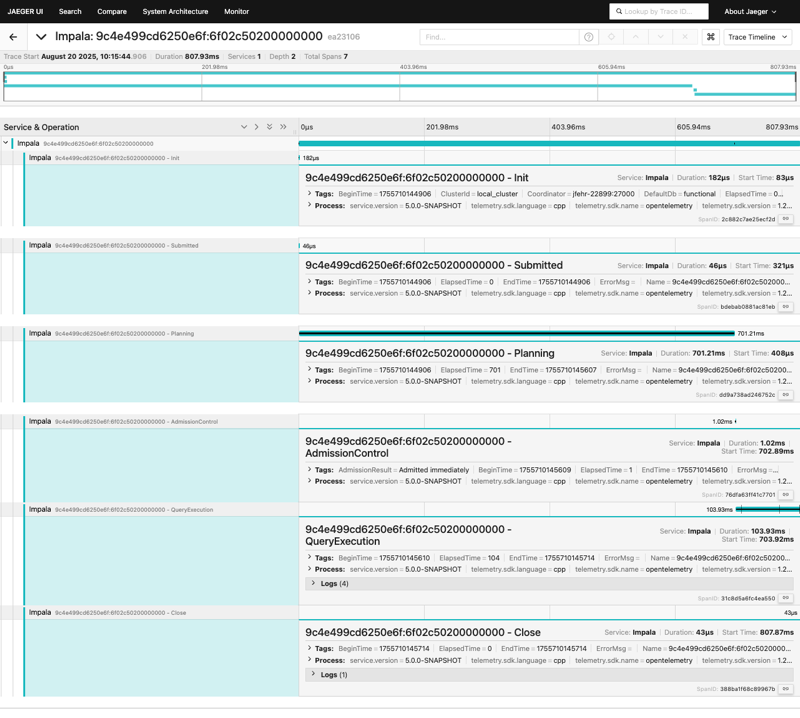
By inspecting the individual child spans, you can gain deep insights into the performance of each stage of the query. For example, you can see how much time was spent on planning, admission control, and execution.
The following query stages are shown in the child spans:
- Query initialization – This span is generated immediately when a query is received to capture the initial setup and is useful for checking early details, such as the user and query ID.
- Query planning – This span shows the time taken to plan the query. A long duration here might indicate a complex query or metadata-related issues.
- Admission control – This span records the time spent waiting for resources. A long duration here suggests high resource contention.
- Query execution – This span represents the time for the actual query to run. This is a crucial metric for evaluating performance.
- Query close – This span marks the end of the query lifecycle, including cleanup and final reporting.
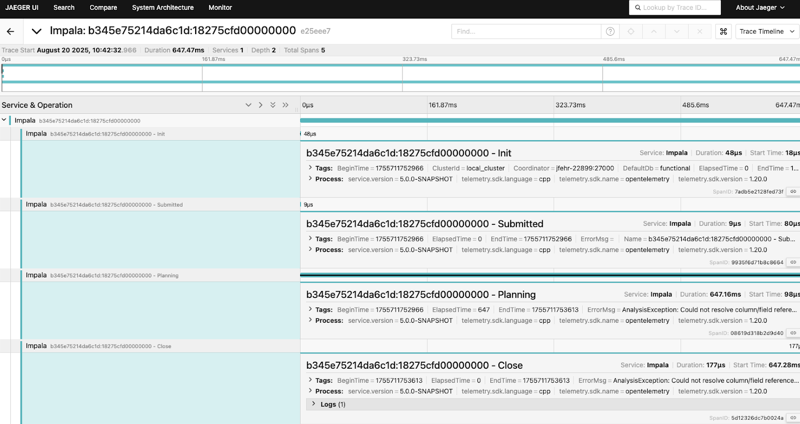
- Failed query –
A
failed query will also generate a trace that can be analyzed to understand the cause of
the
failure.
In this example, the query failed during the
planning phase, likely due to a syntax error or a non-existent table. The root span is
marked with an error tag, and the logs provide details on the failure.
Analyzing these spans helps you identify performance bottlenecks and understand the entire lifecycle of a query within your Impala Virtual Warehouse.