About the Impala Autoscaling Dashboard
The Impala Autoscaling Dashboard helps you to visualize and understand how the Impala Virtual Warehouse autoscales, how the queries are routed to an executor group set, how the queries affect the provisioning of the executors, and resource utilization over a specified time window. You can use this dashboard to monitor the regular as well as workload-aware autoscaling.
Impala Autoscaling Dashboard: Key insights
- Query Execution Timeline
- Enables you to analyze to which executor group sets the Impala queries are routed
and why
- You can visualize which executor group sets are assigned what queries. This mainly depends on the resources available to the executor group sets.
- You can also view the timeline of each query's execution: how long was the query queued, when was it admitted, how long did it take to run, and so on.
- Compute Metrics
- Enables you to analyze how the queries that are queued and run affect the
provisioning of the executors
- You can view the number of queued or running queries at any given time.
- You can also view the number of executors that are running, or have scaled up or scaled down over a specified time window.
- Utilization Metrics
- Enables you to analyze resource utilization of the running the queries
- You can view the percentage of available CPU, memory, scratch, and cache that is being used.
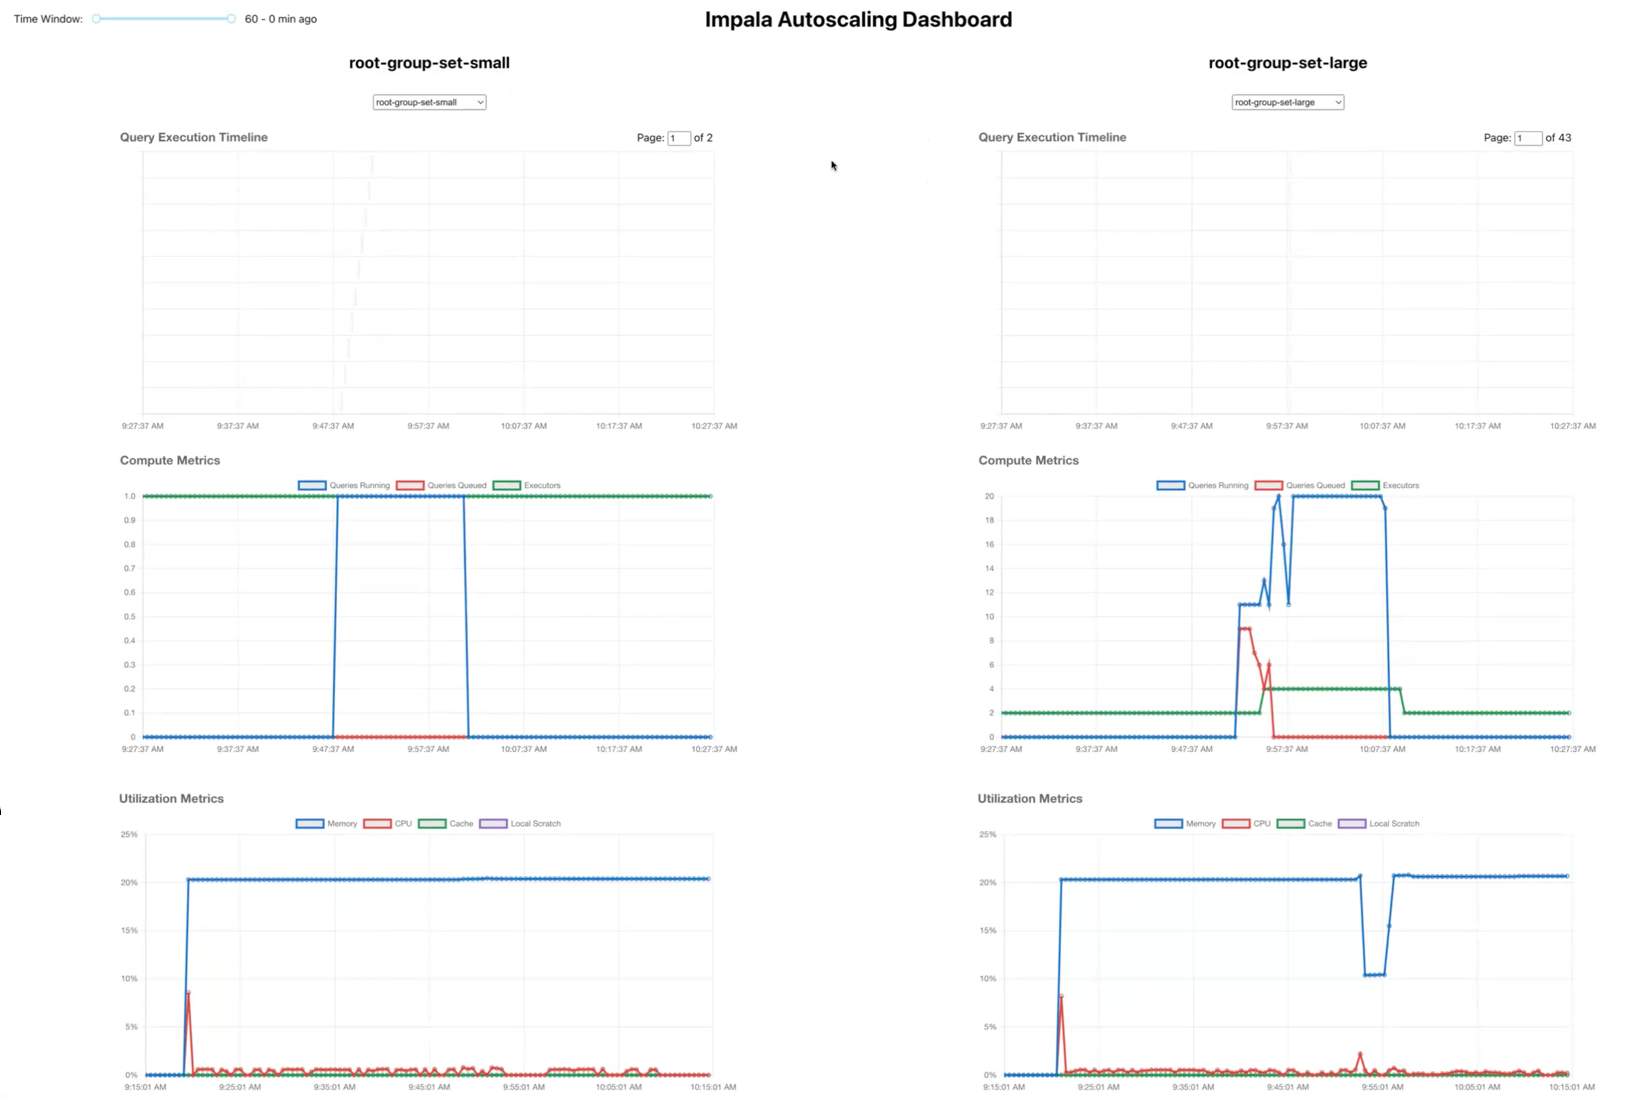
Impala Autoscaling Dashboard: Layout and controls
Each column on the Impala Autoscaling Dashboard is dedicated to an executor group set or a resource pool. For each executor group set, you get interactive charts to analyze query execution timeline, compute metrics, and utilization metrics. Columns for new executor group sets are added if you have selected to use additional executor group sets. If you have not enabled workload-aware autoscaling on your Impala Virtual Warehouse, then only one executor group set is deployed, and you see only one column on the dashboard.

impala-autoscaler-metrics app.
Under each executor group set, there is a drop-down menu that enables you to select executor groups with a set. It enables you to view and analyze the metrics for a specific executor group in detail.
Each query execution timeline page is dedicated to a set of queries that has run in a recent time period. The first page shows the most recently run queries. You can navigate through older queries by increasing the Page number.
On the Query Execution Timeline graph, you can view all the phases of the query's lifecycle. To view details such as query ID, start and end time of a phase, the reason why this query was assigned to this executor group set, you can hover over a phase. You can view the full query profile by clicking on the query's phase bar.