This section provides some examples of OTel backend systems that allow you to view the
telemetry data that is processed and exported from an OTel collector.
Visualizing through Jaeger
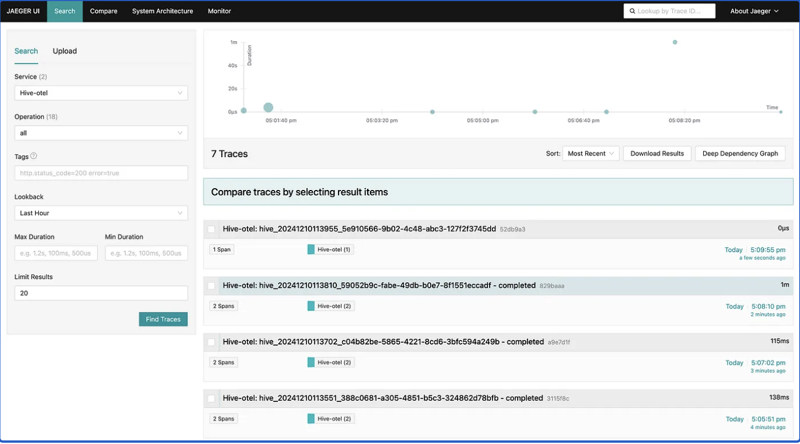
The following image represents a Jaeger UI displaying traces for 4 queries out of which 1
is a live query and the remaining 3 are completed queries. The completed queries are denoted
by the completed suffix and the running queries are denoted by just the
Query ID and do not have a suffix.
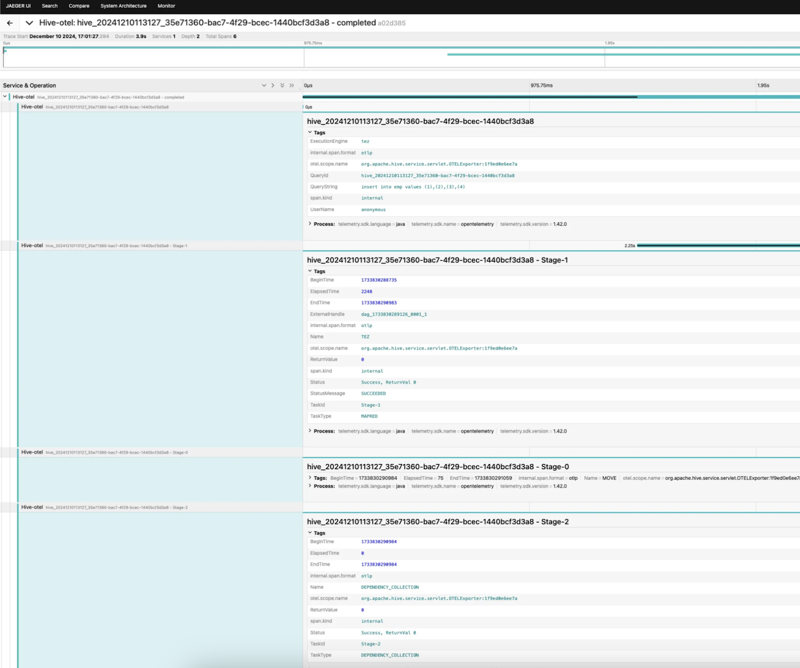
You can click on a trace to view more details about the attributes and tasks. This helps
you understand task breakdowns and performance aspects of individual query components.
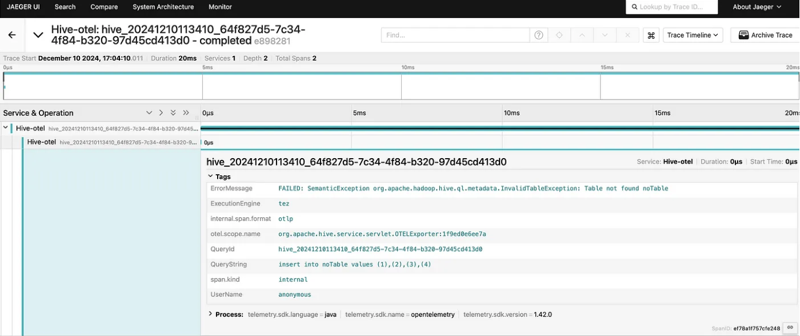
Failed queries display an ErrorMessage in the expanded view enabling you
to troubleshoot and debug effectively.