Flow metrics
Cloudera Data Flow provides metrics for data received and data sent by the entire flow. You can investigate these metrics to identify and resolve performance issues related to your flows.
These metrics help you to understand the performance of a flow. For example, a flow running at 50% CPU utilization may be an expected (and fine) behavior compared to another flow running at 5% CPU utilization. You are the best judge for how your flow should perform and what thresholds for these metrics dictate that. One metric that you specifically monitor is CPU Utilization. If the value goes above the threshold of 80%, you must scale the cluster.
In the Cloudera Data Flow web interface, go to Deployments, select the Flows tab, and click a a flow to view core allocation, disk capacity, CPU utilization, and disk usage metrics on the Flow Metrics tab of the Deployment & Flows pane.
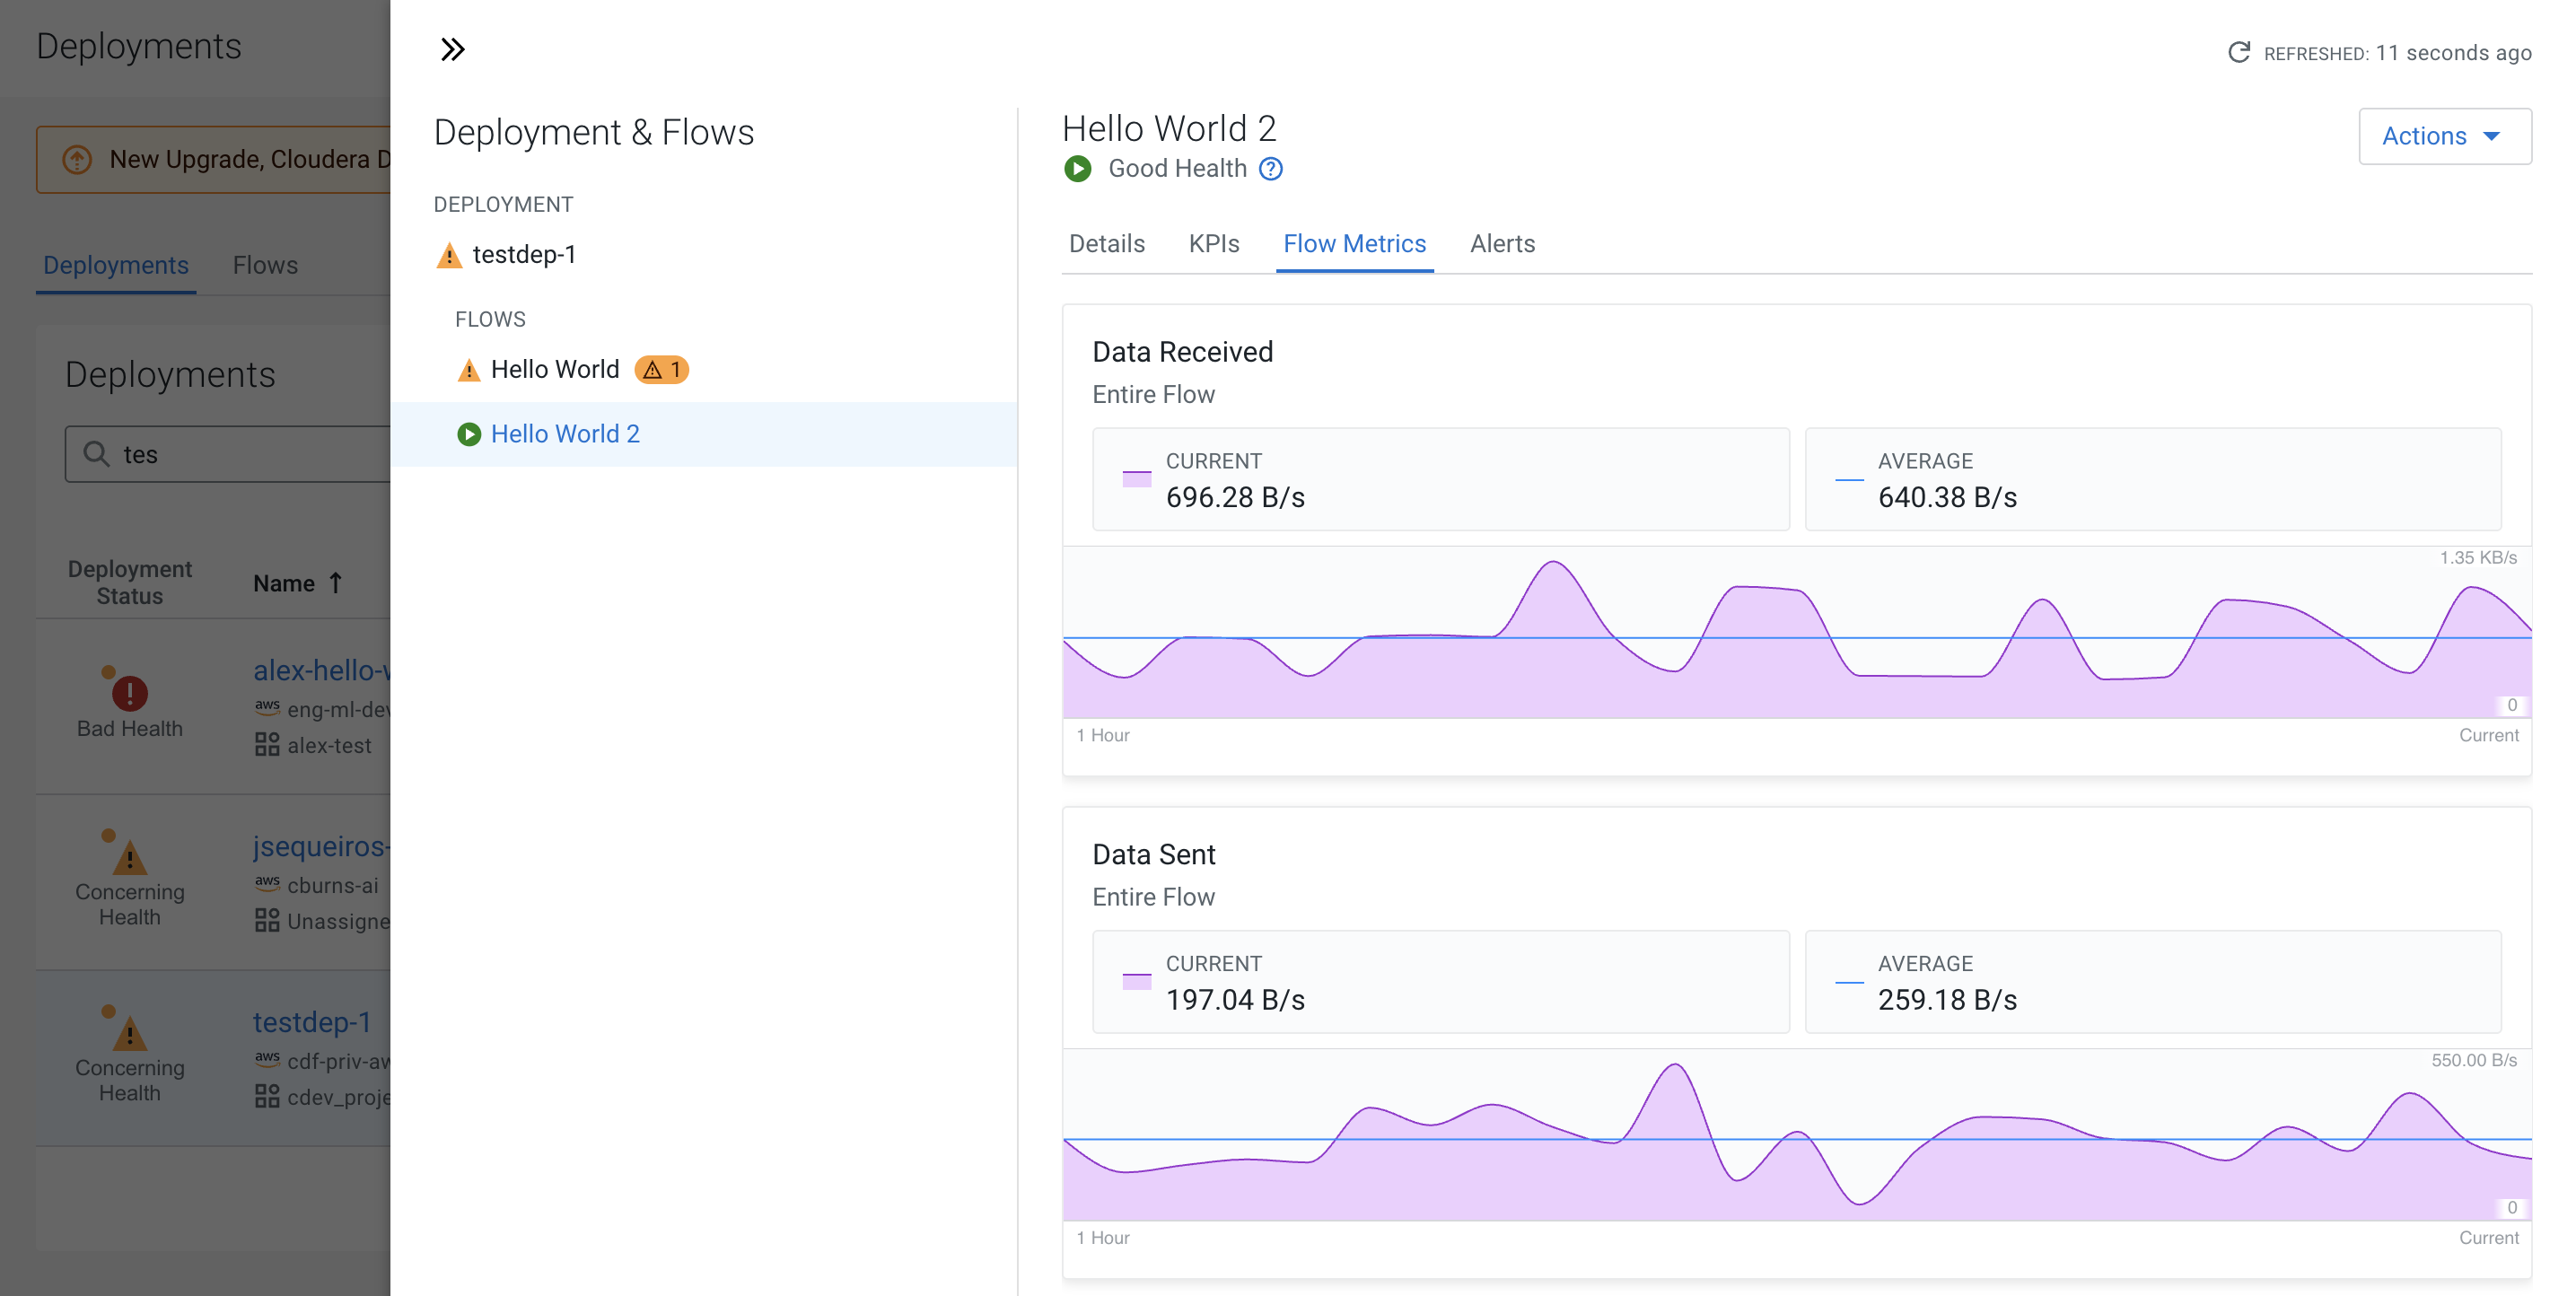
- Data received
-
Shows the amount of data that your flow currently receives from the source.You can move your mouse on the graph and get the amount of data received for a specific point in time.
- Data sent
-
Shows the amount of data that your flow currently sends to its target. You can move your mouse on the graph and get the amount of data sent for a specific point in time.