System metrics
Cloudera Data Flow provides comprehensive NiFi cluster-specific metrics on core allocation, disk capacity utilisation, CPU utilisation, and disk usage. You can investigate these system metrics to identify and resolve performance issues related to your NiFi deployments.
Everytime you deploy and run a NiFi flow, you do so in a, new or existing, NiFi cluster. The system metrics are details about the NiFi cluster that provide an opportunity to understand the flow deployment status.
These metrics help you to oversee the economy of your system. For example, a deployment running at 50% CPU utilization may be an expected (and fine) behavior compared to another one running at 5% CPU utilization. You are the best judge for how your system should perform and what thresholds for these metrics dictate that. One metric that you specifically monitor is CPU Utilization. If the value goes above the threshold of 80%, you must scale the cluster.
You can set the key performance indicators (KPIs) against your deployments, and which alerts to be sent if certain metrics meet a particular threshold. You might detect situations that are not errors but critical information to be notified on regarding the state of the system. For example, a cluster size reaching the maximum value that is allowed.
The values you measure for metrics depend on the hardware chosen during deployment. For example, the NiFi node size you select (Extra Small to Large). These selections enable a deployment to access CPU, memory, or storage which can cause numbers measured to change.
In the Cloudera Data Flow web interface, go to Deployments and click a deployment to view core allocation, disk capacity, CPU utilization, and disk usage metrics on the System Metrics tab of the Deployment Details pane.
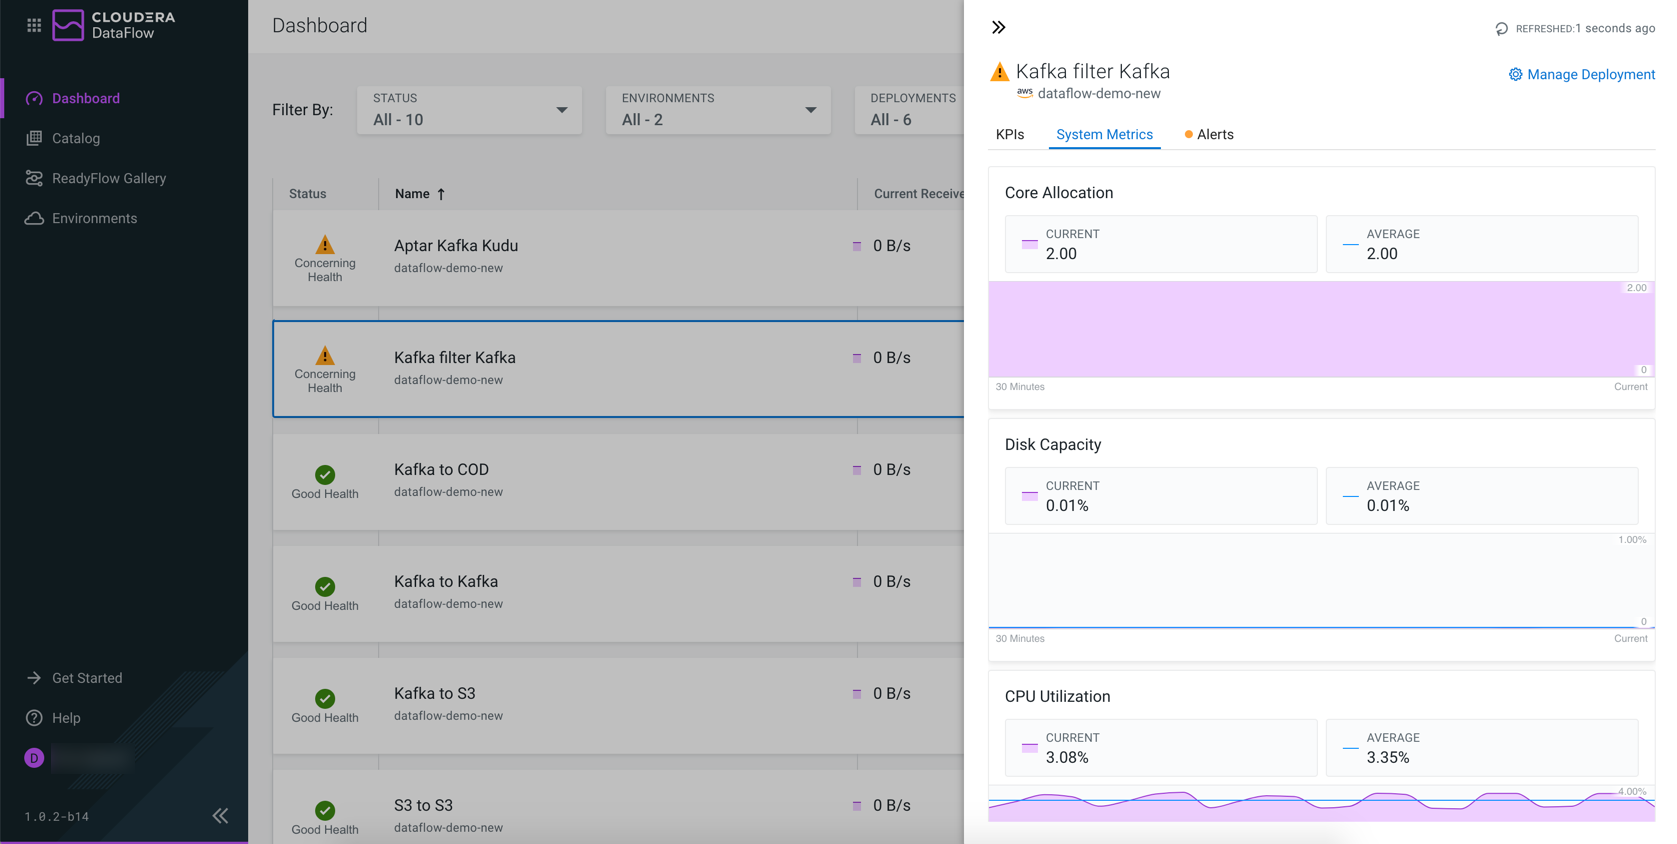
- Core Allocation
- Description
- The number of cores that are currently allocated to NiFi containers for the deployment.
- Unit
- vCores
- Functionality
- Monitors current and average core allocation. You can move your mouse on the graph and get core allocation details for a specific point in time.
- Importance
- Helps to assess if the number of cores a flow is using is within the expected range.
- Example
- Together with the size selected when the NiFi flow is deployed, the metric reflects the real size of the cluster in terms of allocated CPU resources. For example, when Extra Small size is selected, each NiFi node is capped at 2 vCores. Therefore, a value of 6 means 3 NiFi nodes are currently running to execute the flow. The value fluctuates when the NiFi cluster is auto-scaled up or down.
- Disk Capacity
- Description
- Percentage of total allocated storage capacity that is being used by the deployment.
- Unit
- Percentage
- Functionality
- Monitors current and average disk capacity. You can move your mouse on the graph and get disk capacity details of a specific point in time.
- Importance
- Helps to identify if a disk is being under utilized or over utilized; however, again it depends on the expected behavior of a flow.
- Example
- This value reflects the storage pressure of the NiFi flow, including
Content,Provence, andFlow Filerepositories. A high percentage can indicate that the traffic is being set in the NiFi cluster, for example, due to failure in delivering the output to the destination system.
- CPU Utilization
- Description
- The ratio of the total CPU time consumed by the deployment in the past 5 minutes over the total allocated CPU quota for the deployment.
- Unit
- Percentage
- Functionality
- Monitors current and average CPU utilization. You can move your mouse on the graph and get the CPU utilization details for a specific point in time.
- Importance
- Helps to identify if a flow is using more or less CPU than expected.
- Example
- The value indicates the computation pressure of the NiFi cluster running the deployed flow. In a typical case, when auto-scaling is enabled and the CPU utilization reaches the threshold internally defined by Cloudera Data Flow more NiFi instances are brought up and join the cluster to share the workload, before the value starts dropping.
- Disk Usage
- Description
- The total amount of bytes saved on the storage volumes of the deployment.
- Unit
- GB, MB, and so on depending on the scale of the value
- Functionality
- Monitors current and average disk usage. You can move your mouse on the graph and get the disk usage details for a specific point in time.
- Importance
- Provides visibility of how much disk is being used by the deployment or Kubernetes node. It can be used to assess what is utilizing a lot of space.
- Example
- Enables you to know the current absolute amount of on-disk data of the whole deployment, which may indicate how long an offloading can take.