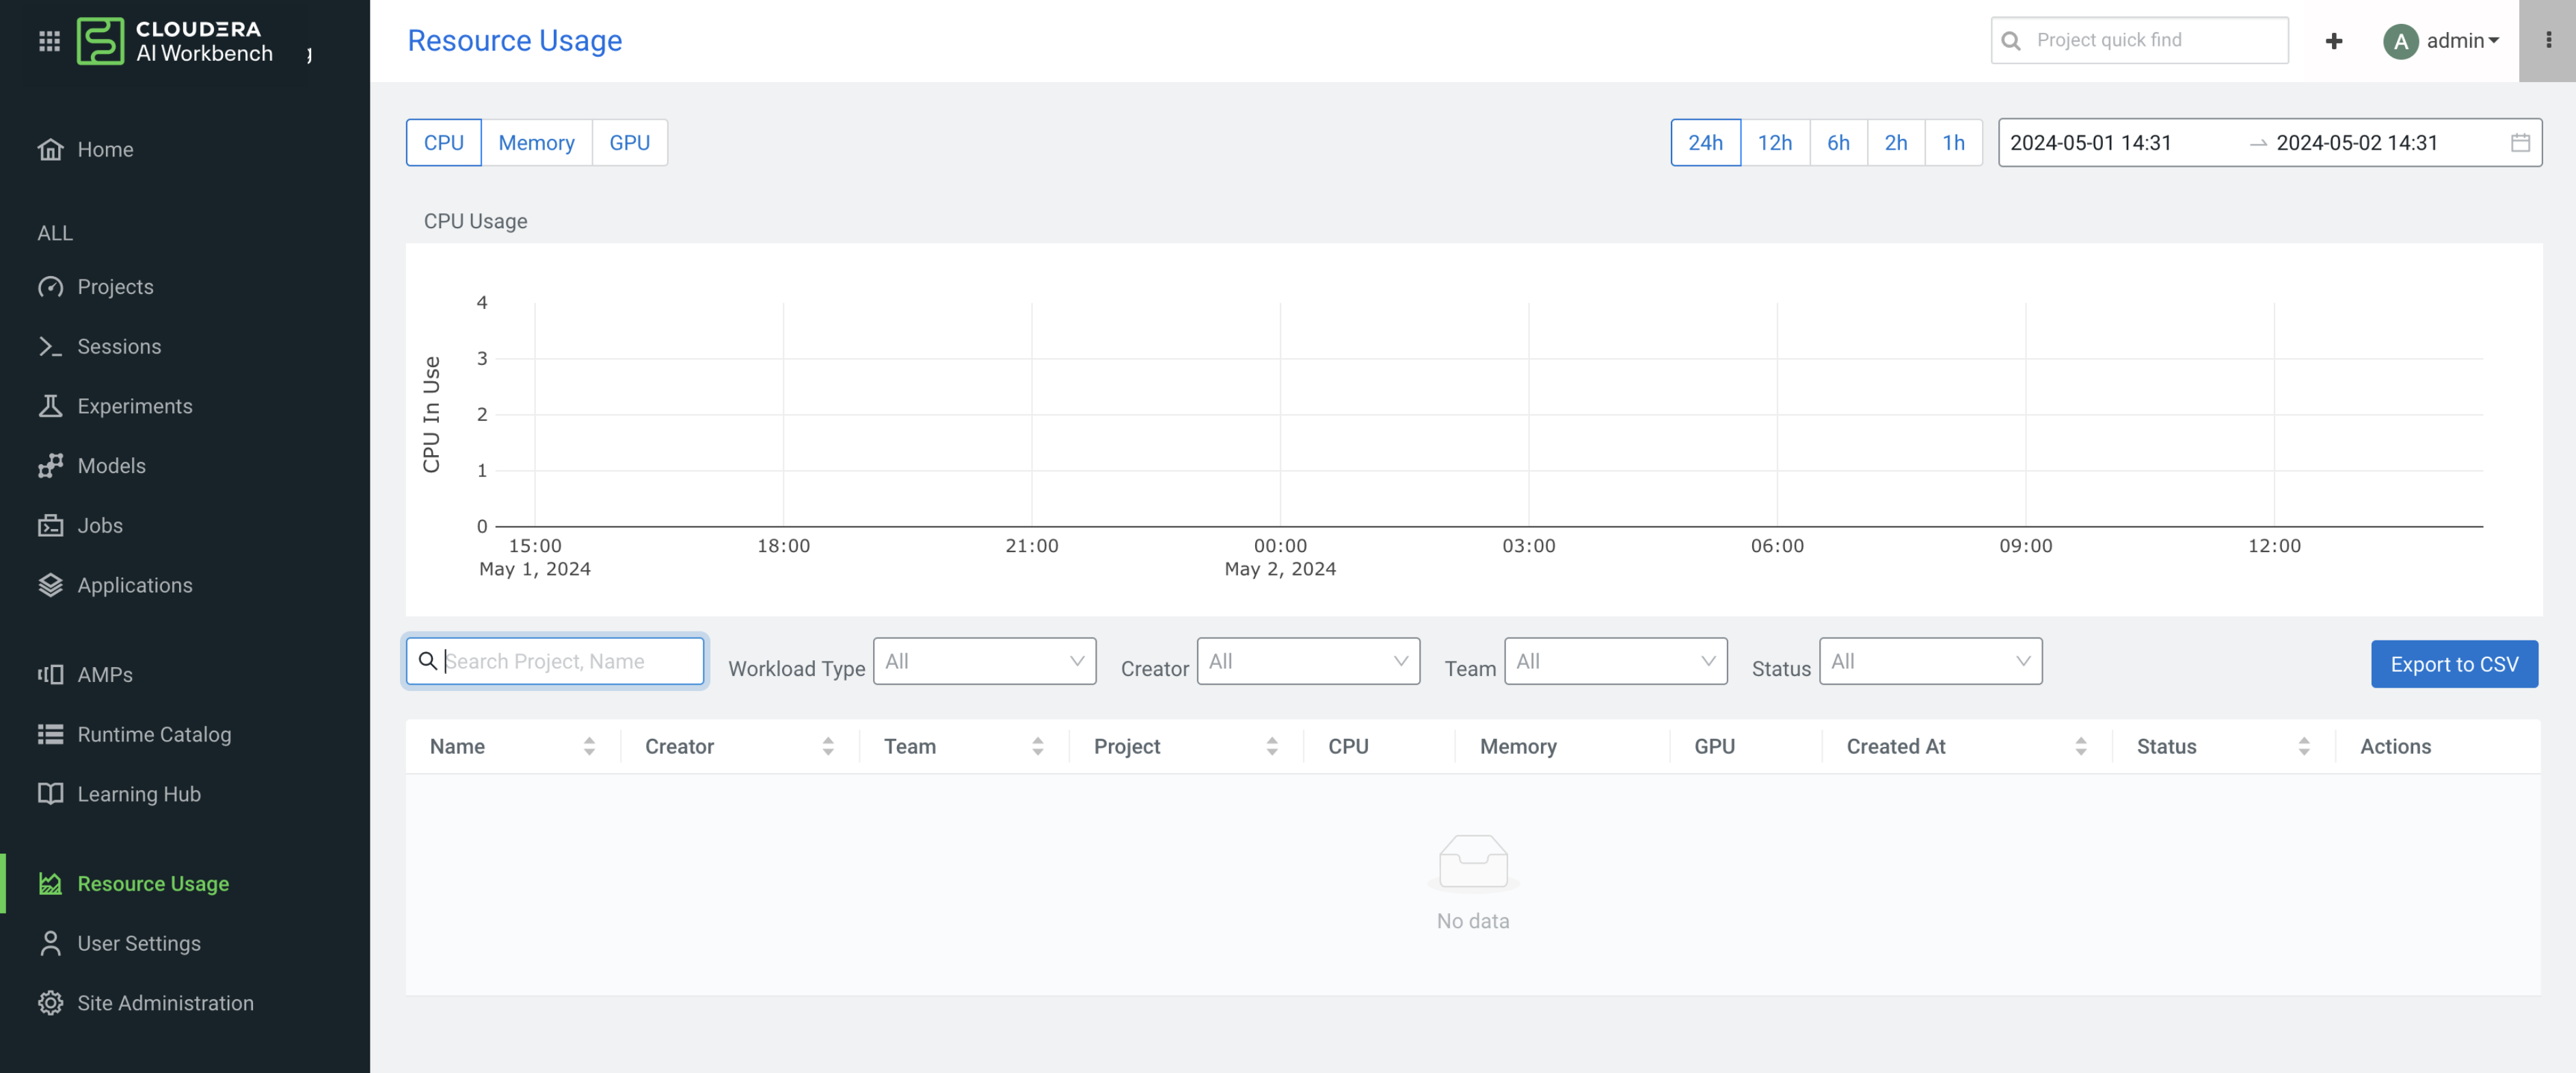
Resource Usage Dashboard
The Resource Usage Dashboard is developed on top of Quota Management to depict the resource usage metrics.
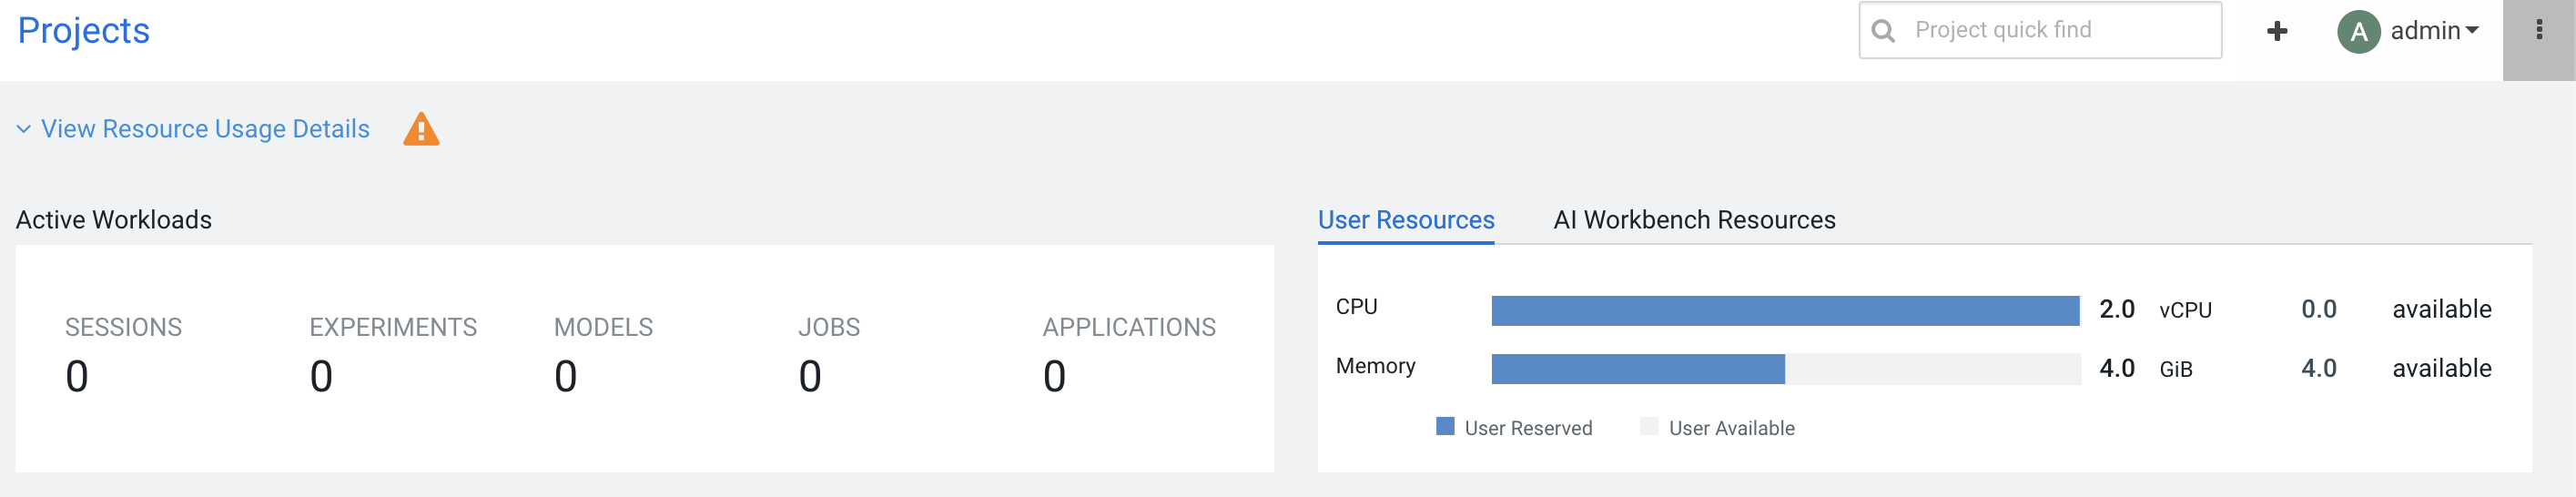
A user- and team-specific resource summary page is available based on the logged-in user or team context.
The Resource Usage Dashboard consists of two parts.
- The Time series chart shows each resource’s usage, based on the filtered time range.
- The Workloads' usage table shows how much resources are utilized by each workload, based on the filtered time range.
The information on the Resource Usage Details is available from the Projects page, by selecting the View Resource Usage Details button.
Resource usage dashboard in Cloudera AI on premises 1.5.5 SP1 and lower releases
For Cloudera AI on premises 1.5.5 SP1 and lower releases, the resource options on the top left side (CPU, Memory and GPU) are used to show or filter the selected resource usage, based on a filtered time range. The date and time range options on the top right side are global filters which are used to filter both the time-series chart and the workloads' usage table.
There is also an export button to download the Workloads' usage table into CSV format.