Cloudera AI leverages Cloudera Monitoring based on Prometheus and Grafana to
provide dashboards that allow you to monitor how CPU, memory, storage, and other resources are
being consumed by your Cloudera AI Workbenches.
Prometheus is an internal data source that is auto-populated with resource consumption data for
each deployment. Grafana is the monitoring dashboard that allows you to create visualizations for
resource consumption data from Prometheus. By default, Cloudera AI provides three Grafana dashboards:
K8 Cluster, K8s Containers, and K8s
Node. You can extend these dashboards or create more panels for other metrics. For
more information, see the Grafana documentation.
In the Cloudera console, click
the Cloudera AI tile.
The Cloudera AI Workbenches page displays.
Click on the name of the workbench.
The workbench Home page
displays.
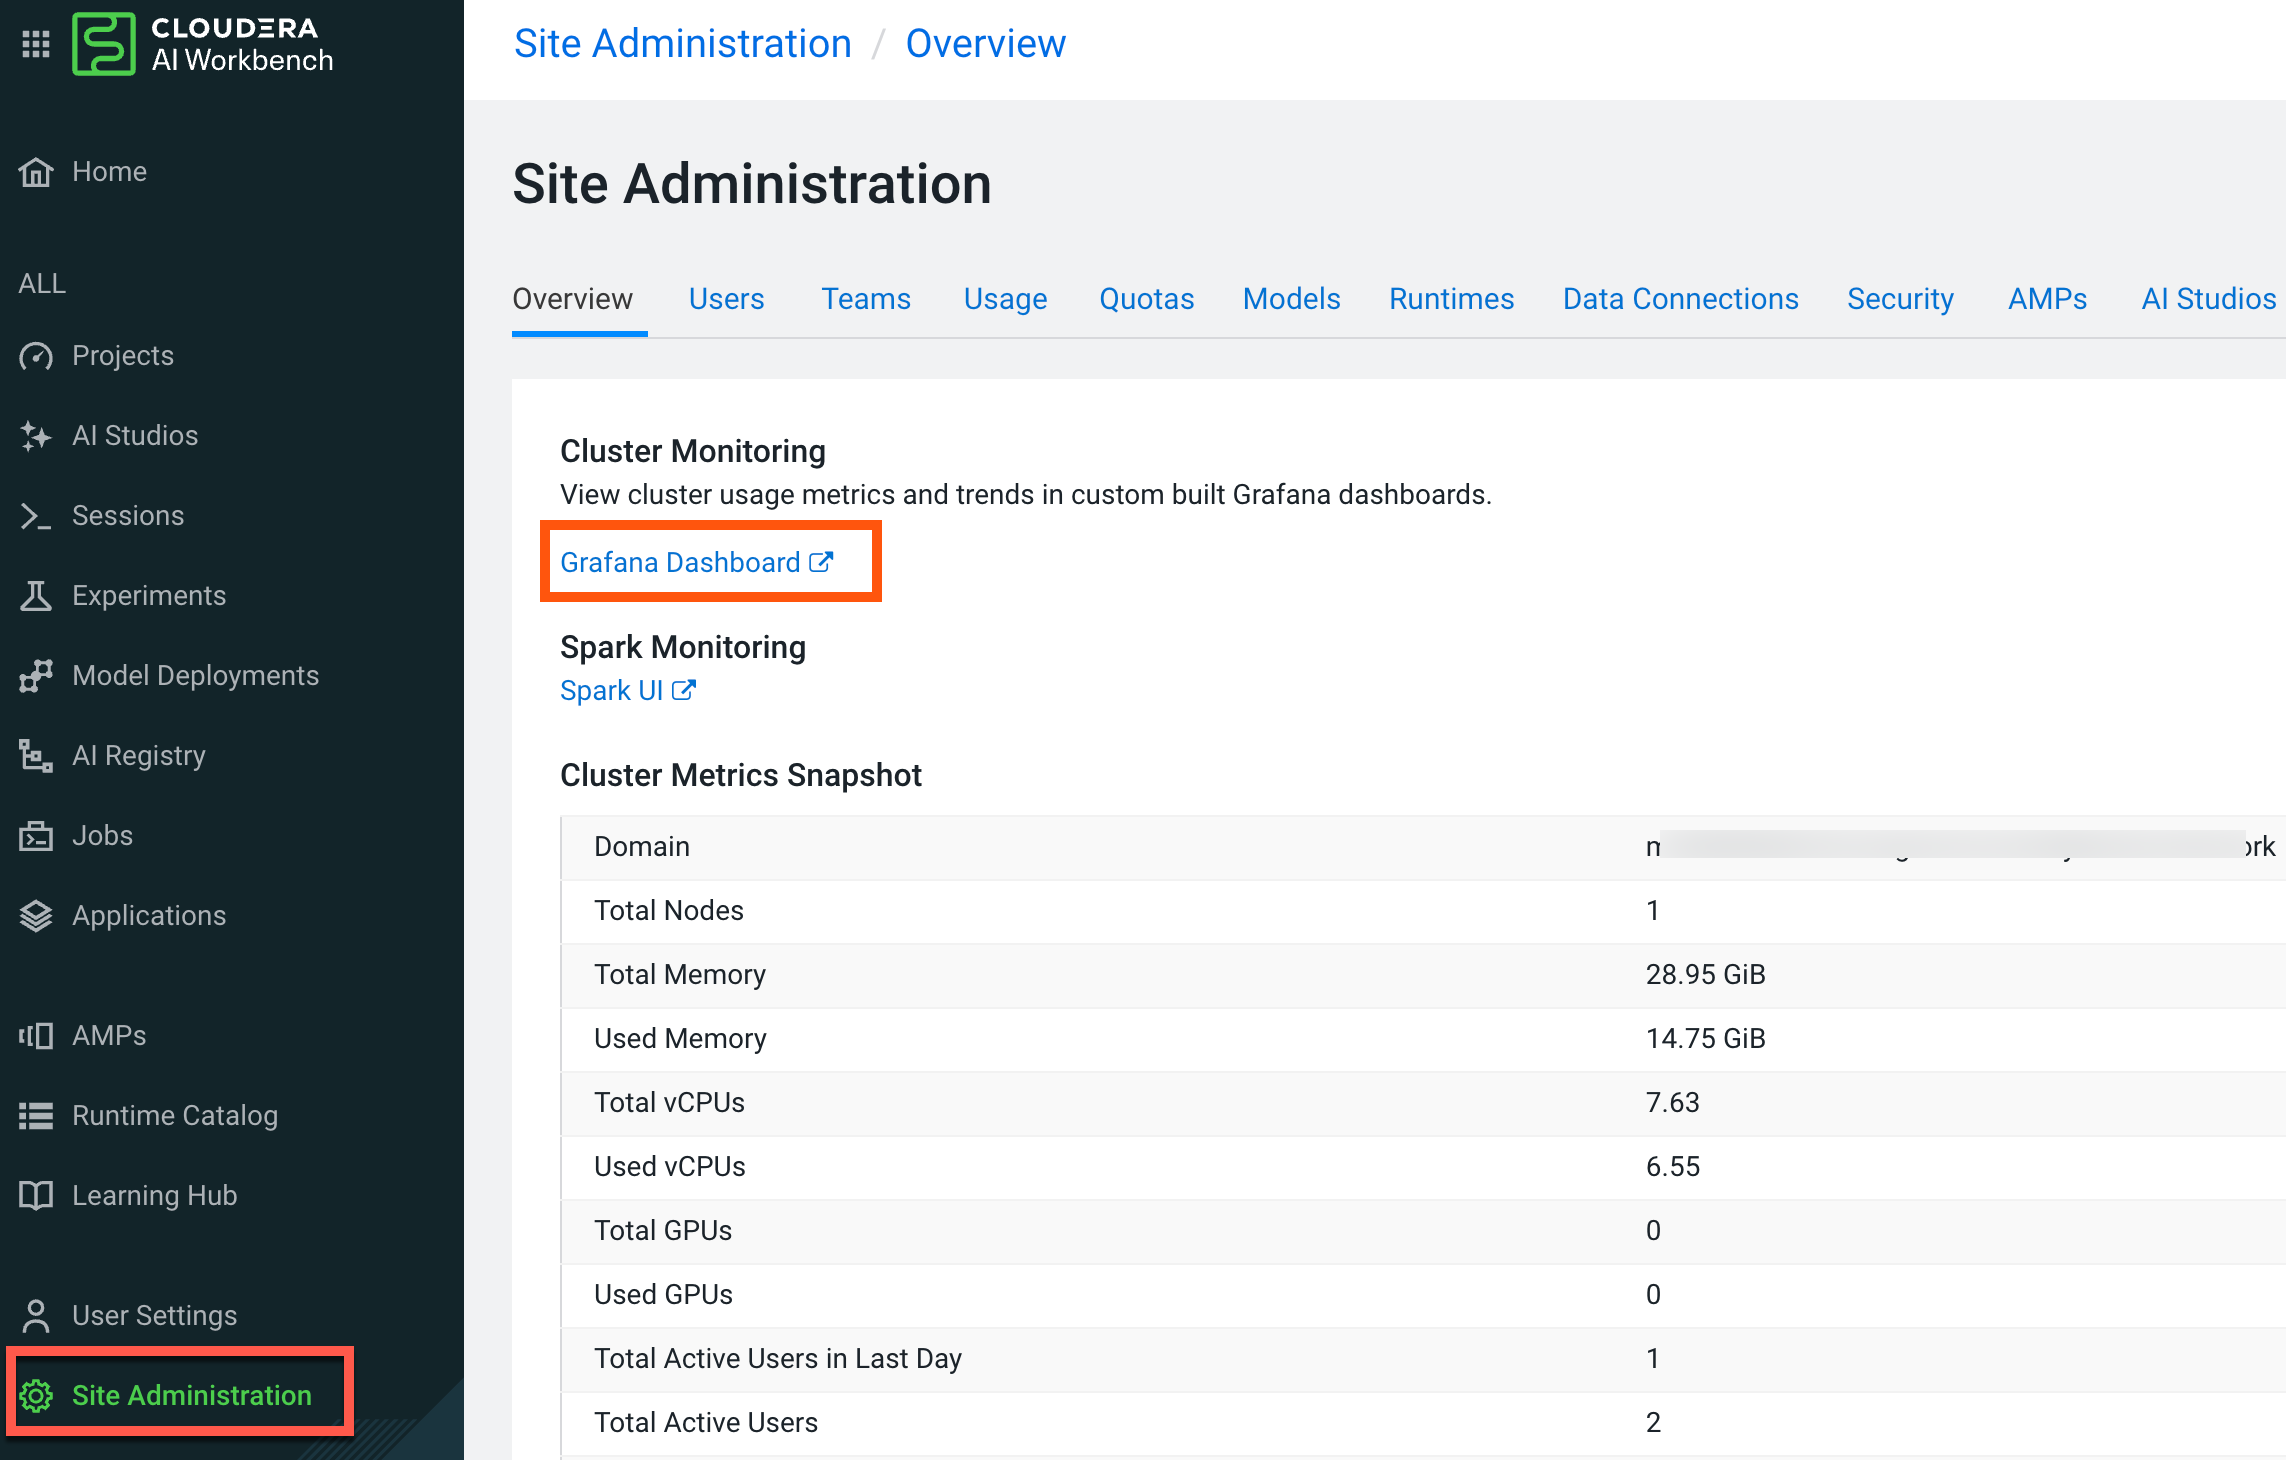
Click Site Administration in the left navigation pane.
In the Overview tab, click Grafana Dashboard.Information about CPU, memory, storage, and other resources are being consumed by your
workbench is displayed.