Management Console Dashboard
CDP Management Console dashboard provides insight into the health of the control plane components and environment. You can also view all the issues in a single location and easily manage and administer the cluster. The list of environments and various components of Management Console are updated dynamically.
You can view a summary of the CDP environment in the Dashboard page by clicking Dashboard in the left navigation panel.
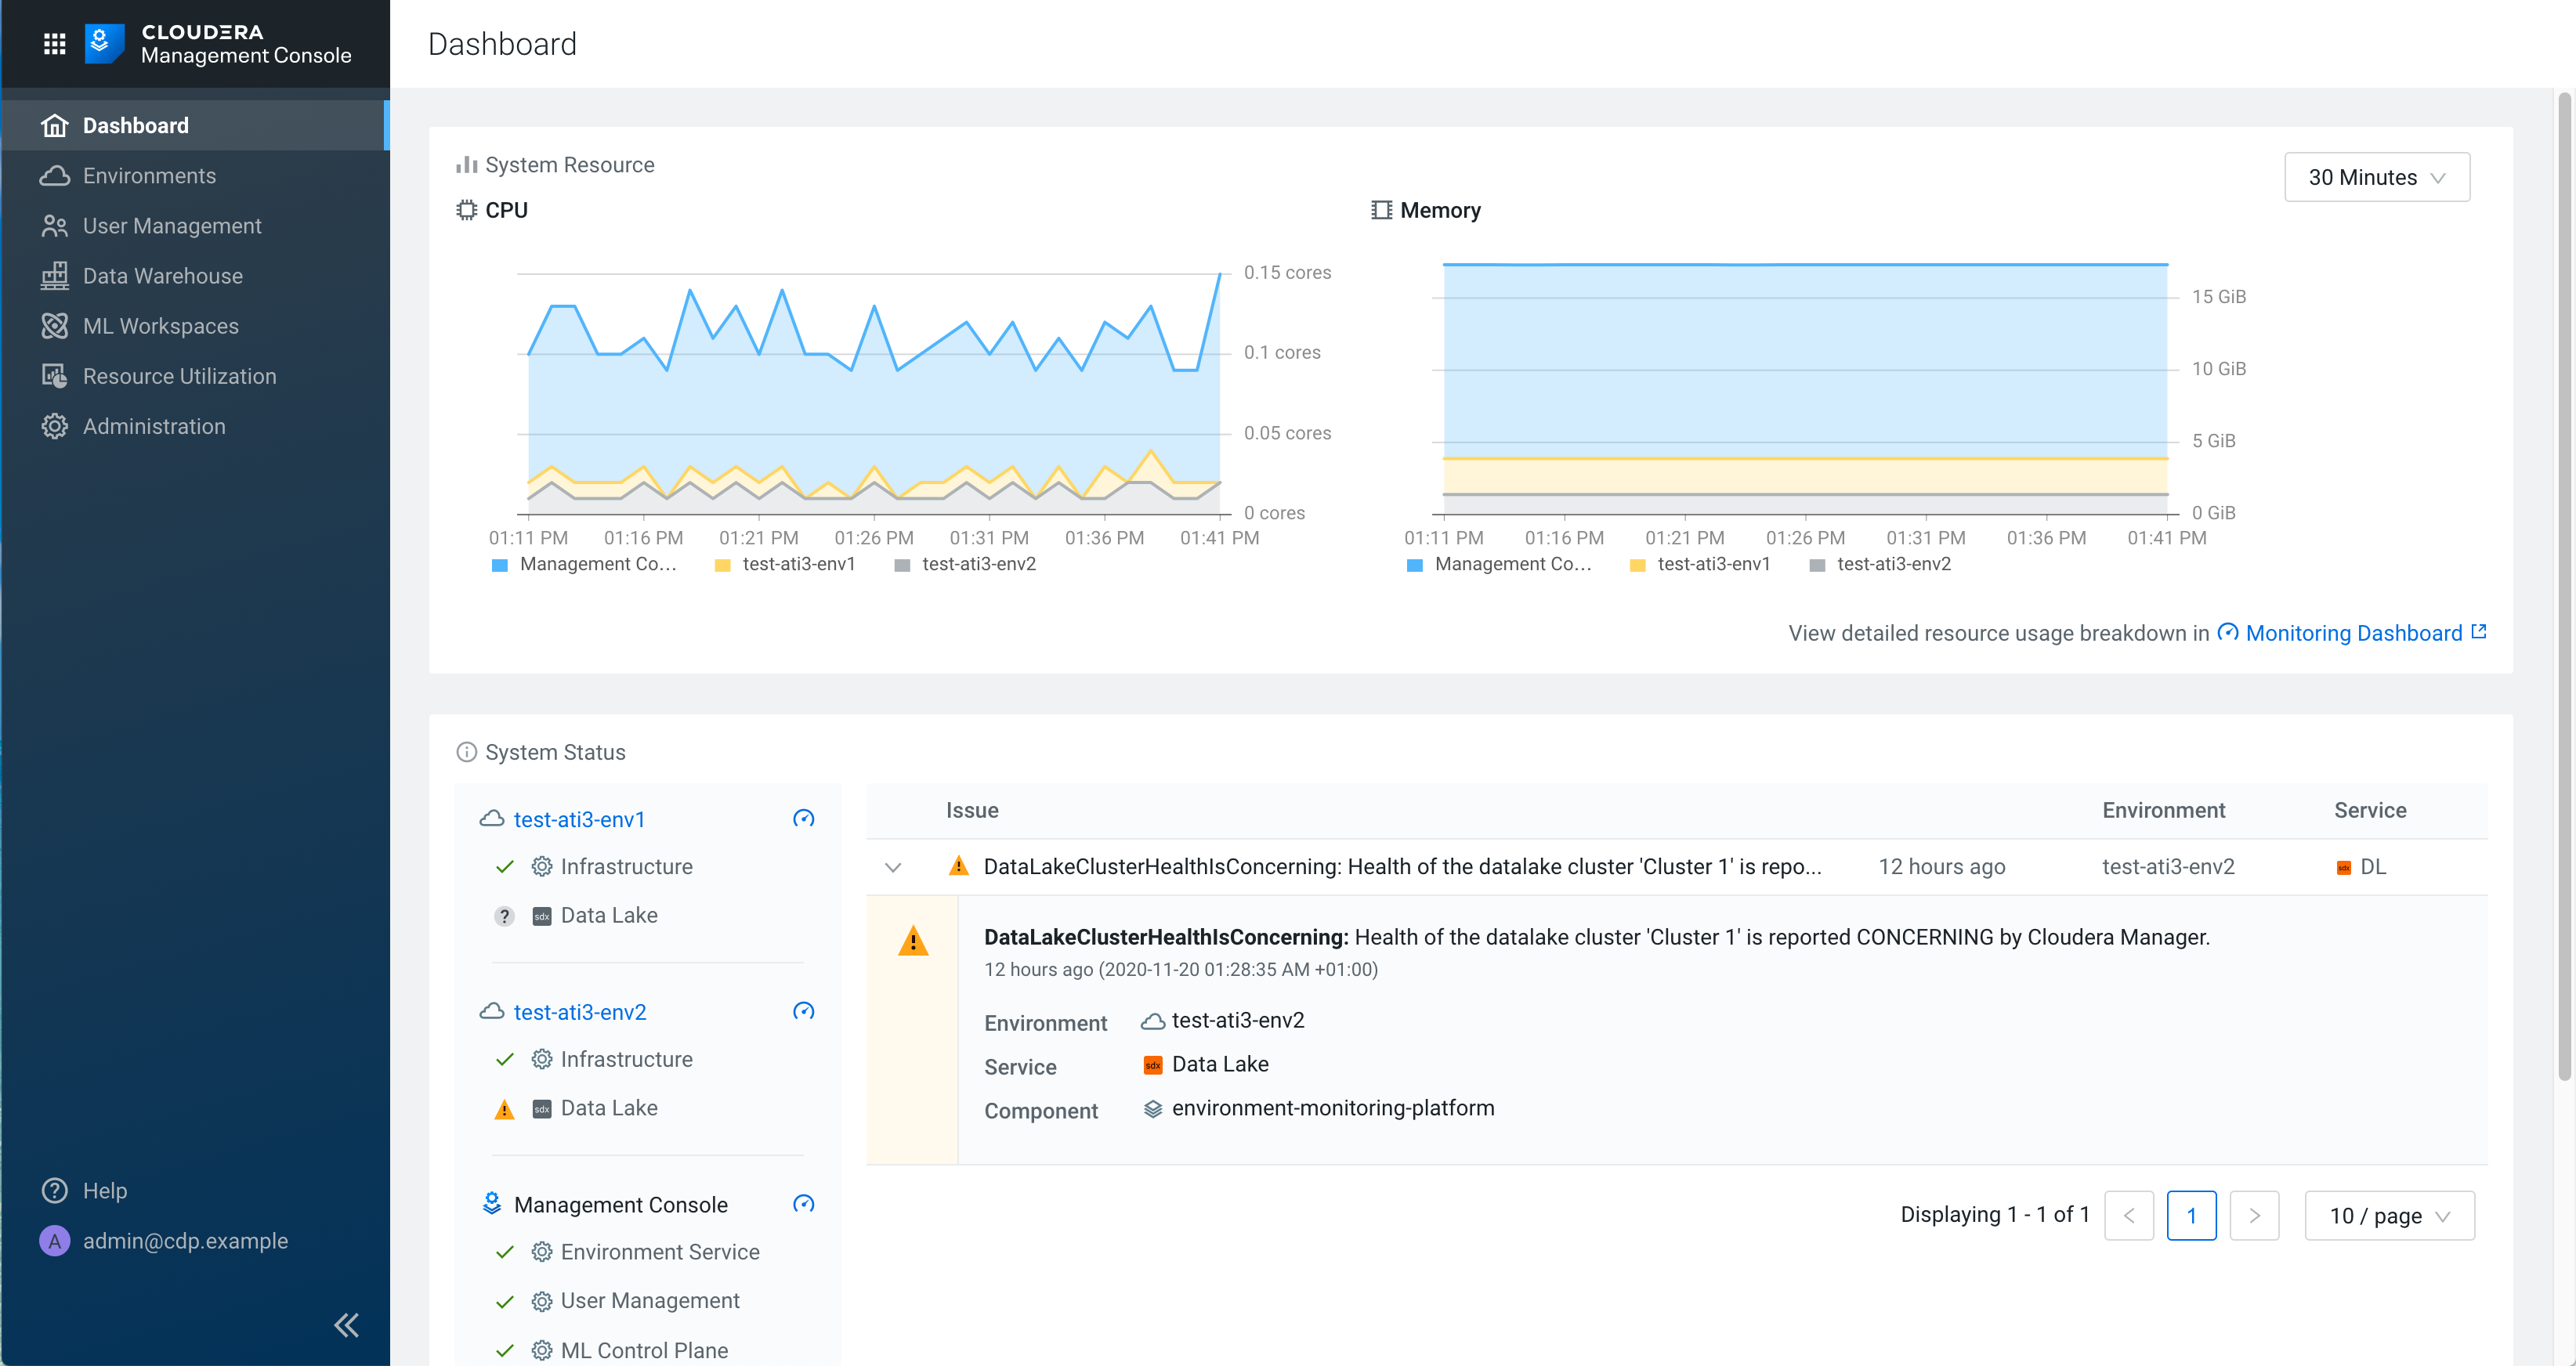
- CPU - Provides information about the number of cores used by the workloads
- Memory - Provides information about the memory used by the workloads
- System Status
- Environment - Displays health information of the control plane, Data Lake, currently running workloads, and associated alerts.
- Management Console - Displays health of the control plane and associated alerts
- Issues - Displays the alerts, status, errors, and warnings related to the environments and workloads. Each alert provides information about the environment, service, component, timestamp, and optionally a link that provides more details.
- Display - Allows you to specify the number of alerts per page using the Display option.
- Time Range - Allows you to select a time range from the available options, between 30 minutes to 1 day, and view resource usage data of a specific environment.
You can filter the alerts based on the environments and workloads.