Cloudera includes a user interface that allows you to
monitor your credit consumption and download your consumption records.
Clouderaon cloud displays consumption data in terms of credits. A credit
is a unit of consumption in Clouderaon cloud.
There is a 3-day delay for the consumption data displayed on the Consumption page. This means
that consumption data from the past three days is not displayed.
Required roles: BillingAdmin
Steps
Navigate to the Cloudera web interface and select
Cloudera Management Console.
Select Consumption from the navigation pane.
Select a date range to display the consumption for a time period. The selected time period
can be one month, three months, six months and one year in a daily or monthly view.
Select tags to further filter the clusters in the environments for Usage
Insights. The filter uses the user-level tags of the clusters. When selecting
multiple tags, the clusters are displayed using OR logic. For example, if
you select department=engineering and department=finance,
the clusters will be shown on the Usage Insights that have a department
tag value of engineering or finance.
On the Consumption page, you can view the Credit
Summary, Credits Burndown and Usage
Insights. By default, the consumption summaries are shown for all
environments. You can further customize the visualization of consumption based on time,
specific environments, and tags.
Credit Summary
Displays credit information based on your credit subscription.
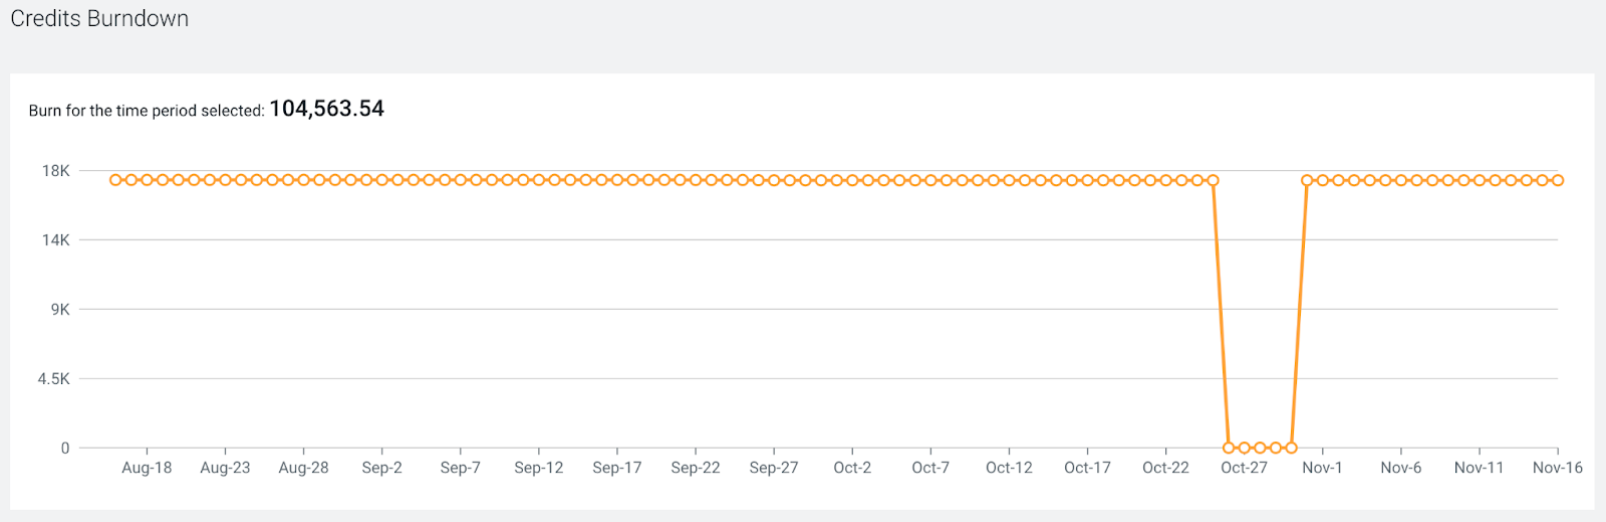
Credits Burndown
Displays the credit used over a period of time.
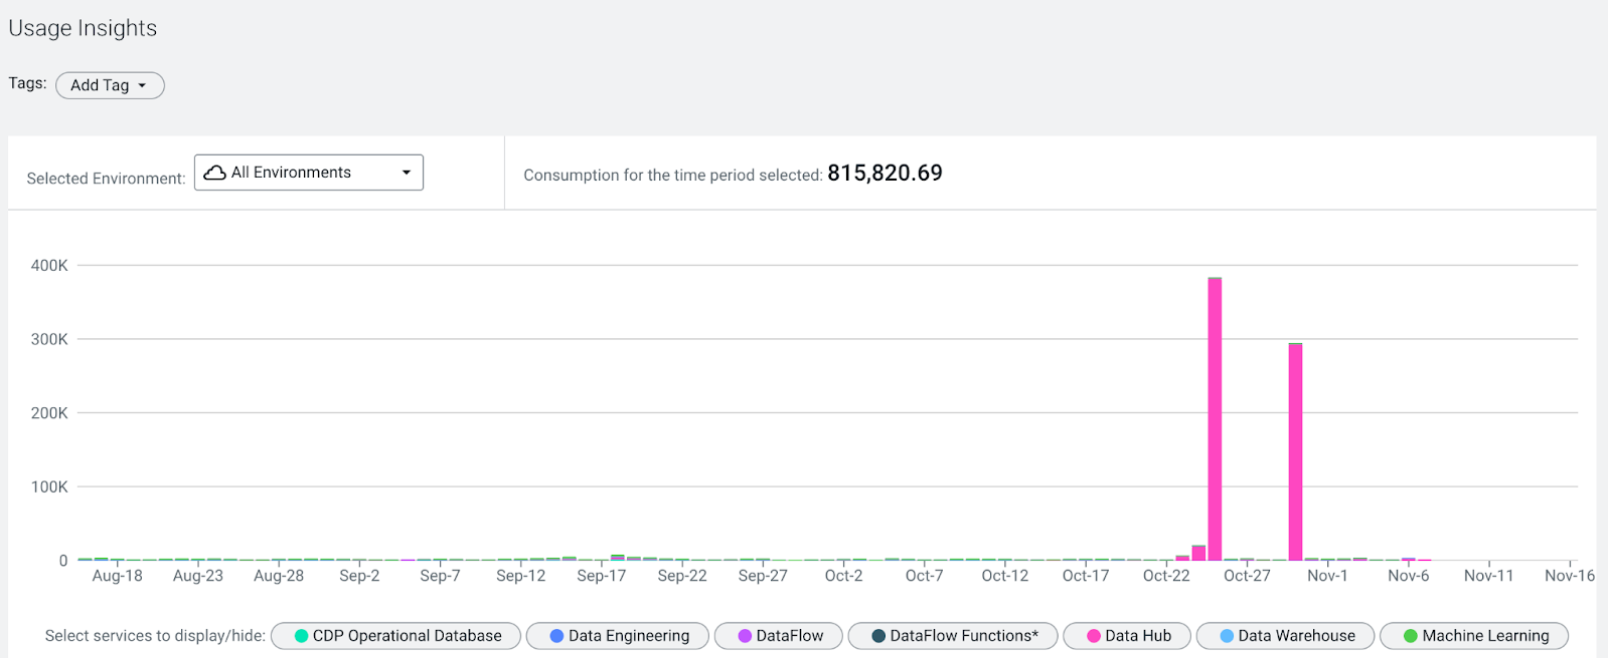
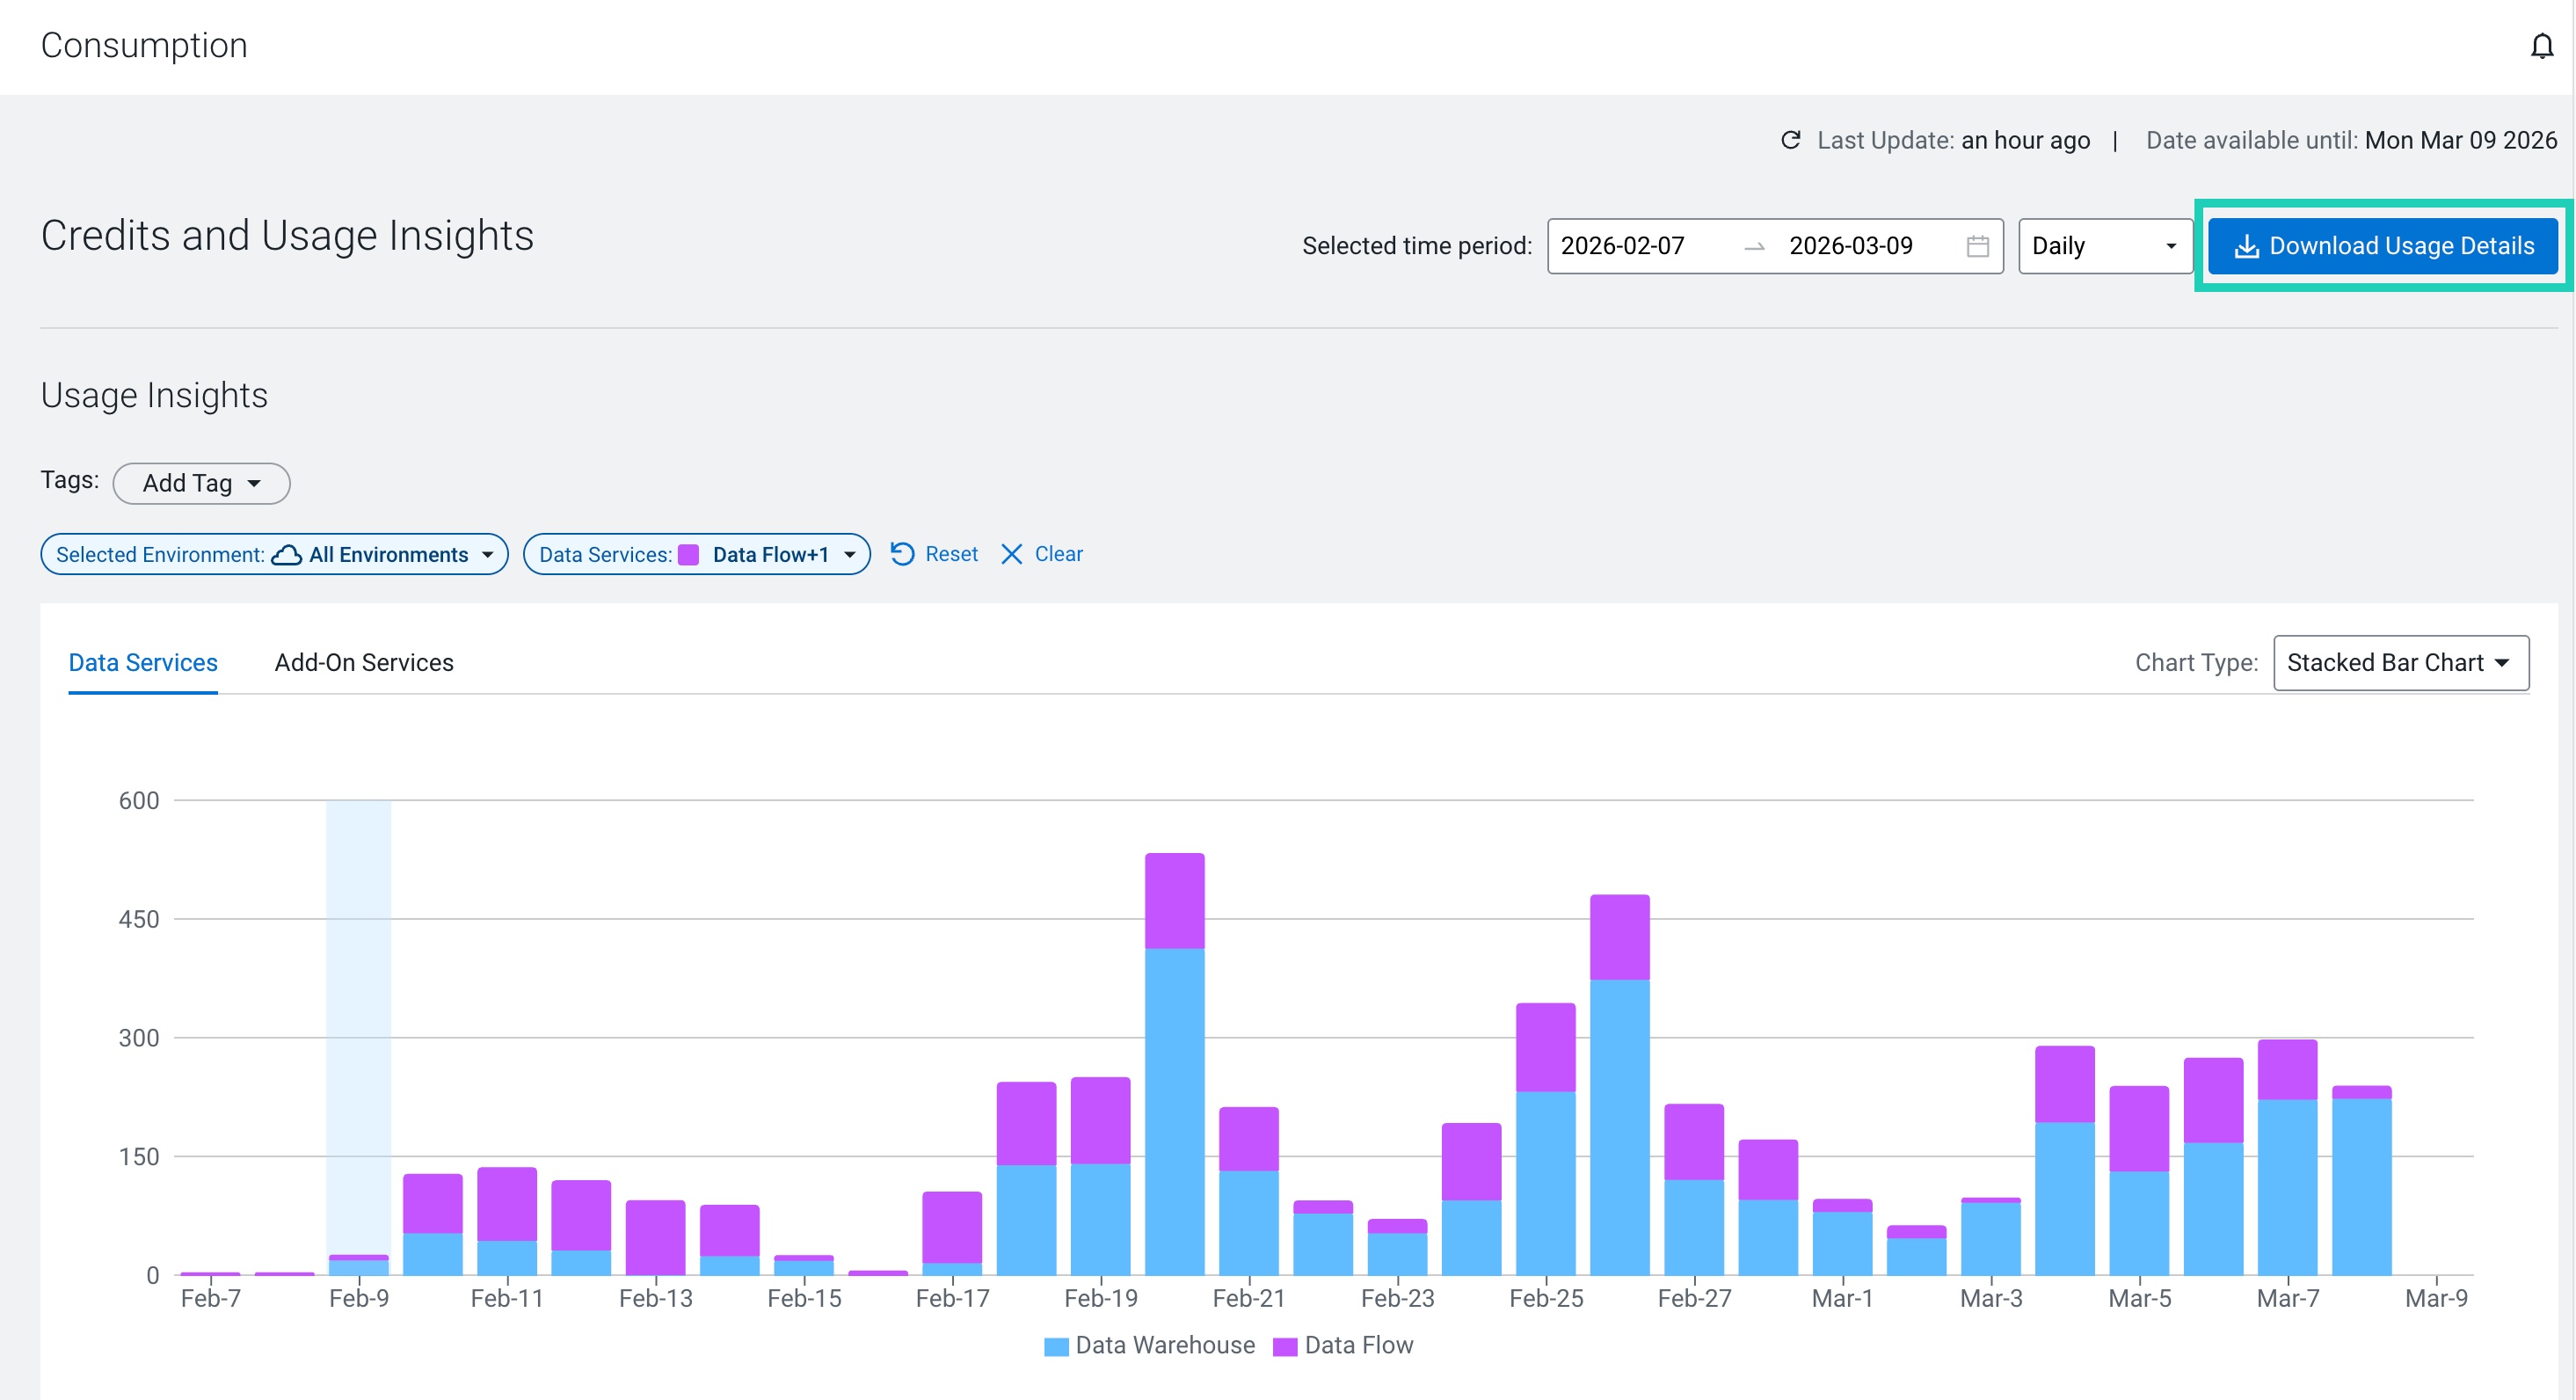
Usage Insights
Displays the total consumption of the Data and Premium Services over a period of
time.
You can use the following filters to further customize the Usage
Insights and the Cluster information:
Selected Environment filter: select all or a
specific environment to view the the environment specific usage patterns
Data Services filter: select all or a
specific Data Service to view the Data Service specific usage patterns
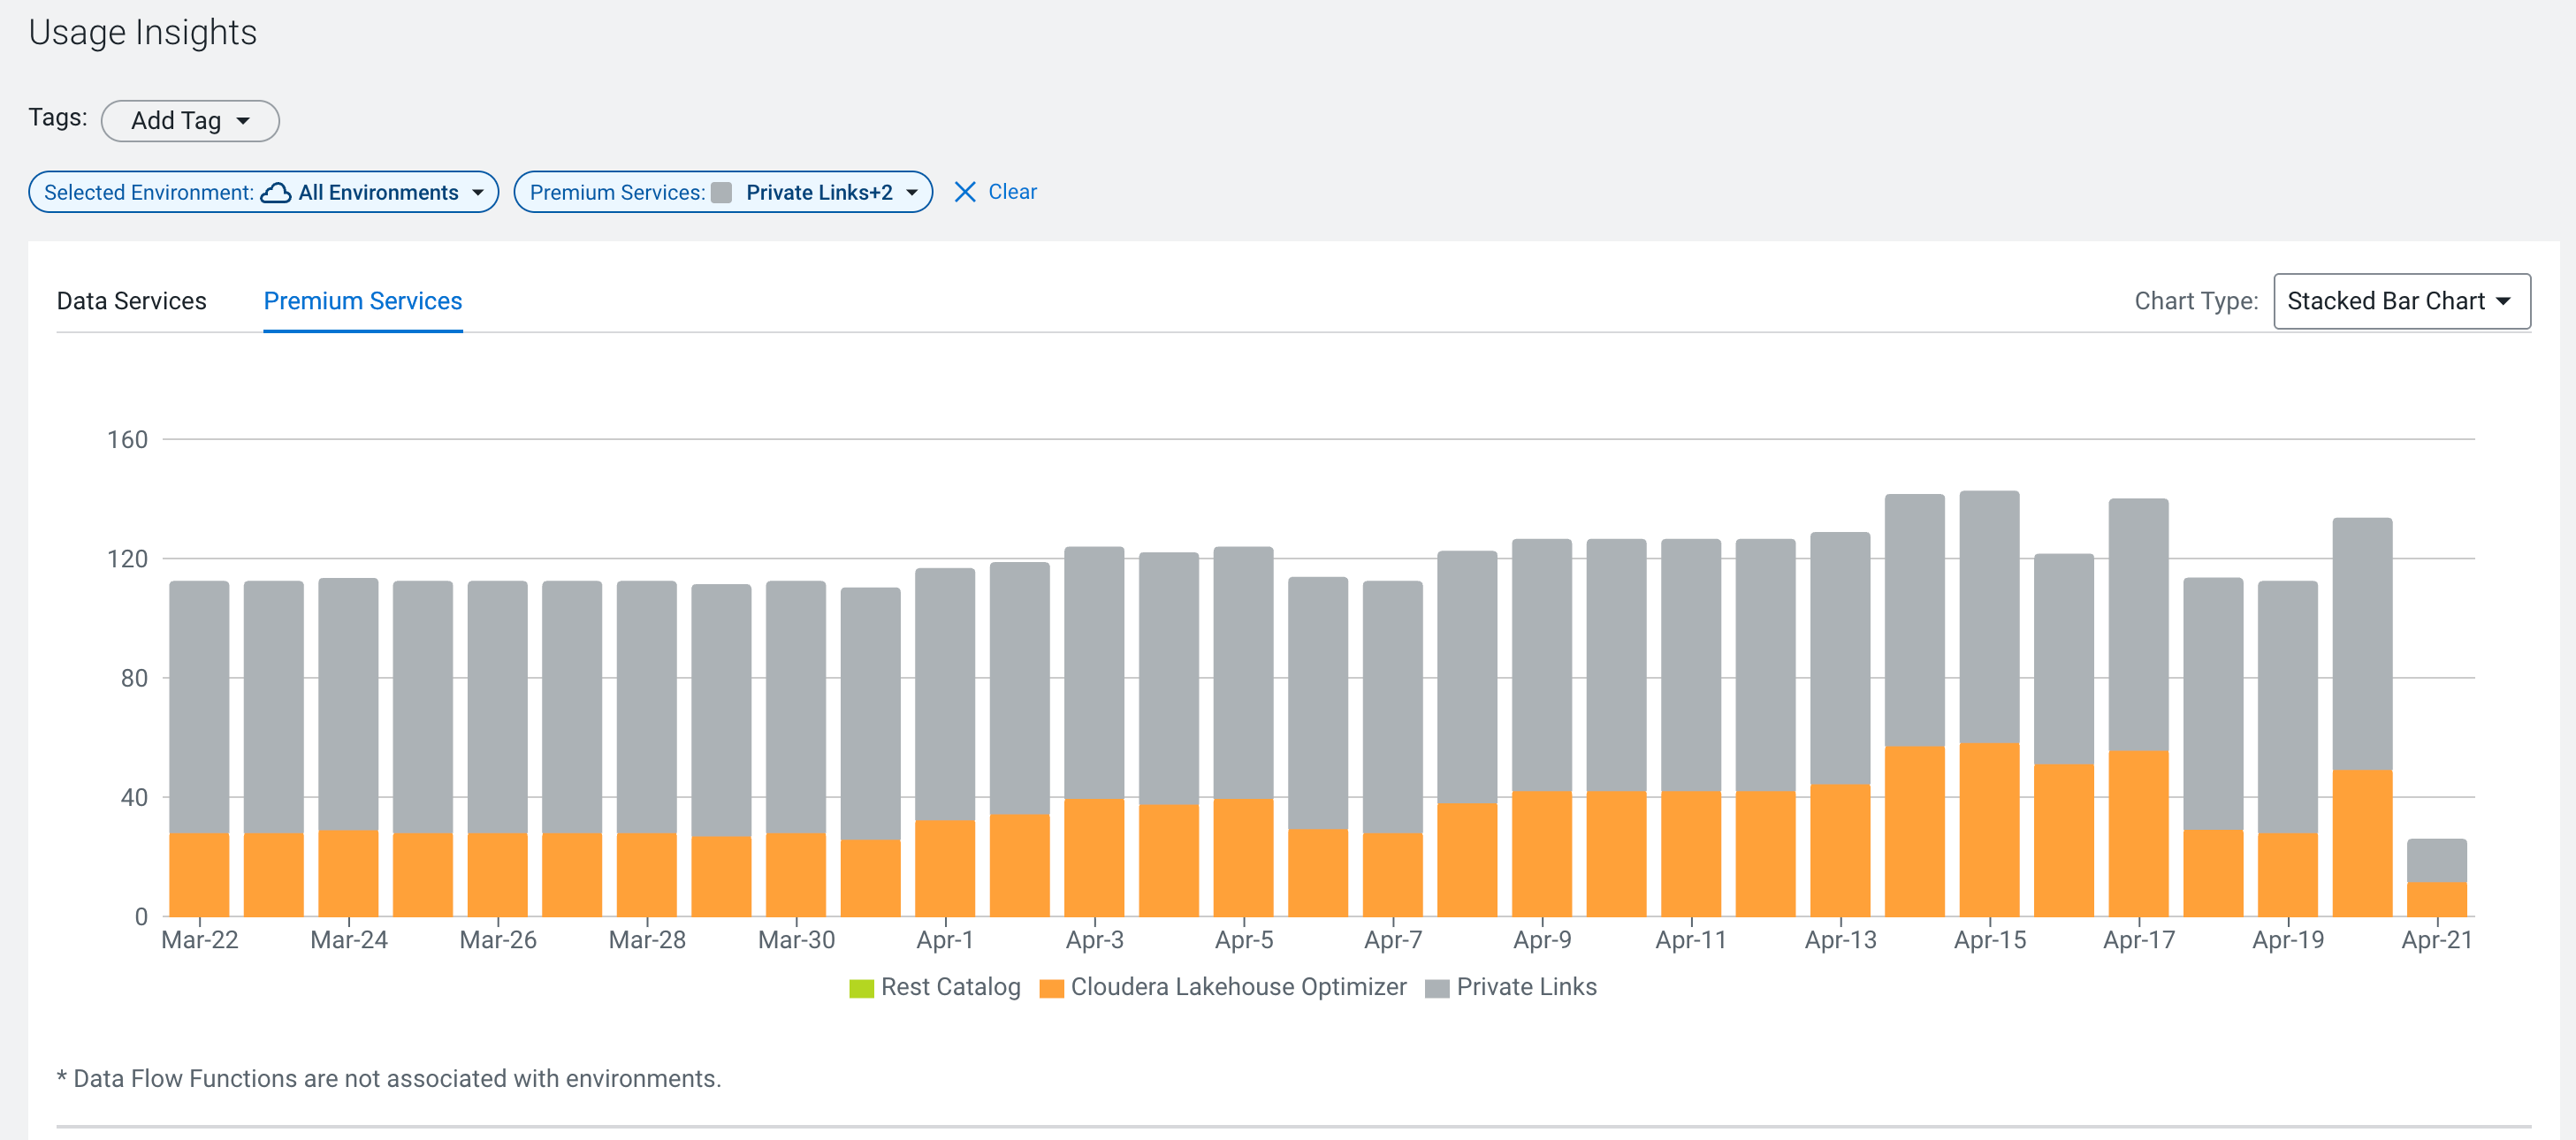
You can also use the Data Services and
Premium Services tabs to switch between the available Data
Service and Premium Services for your Cloudera
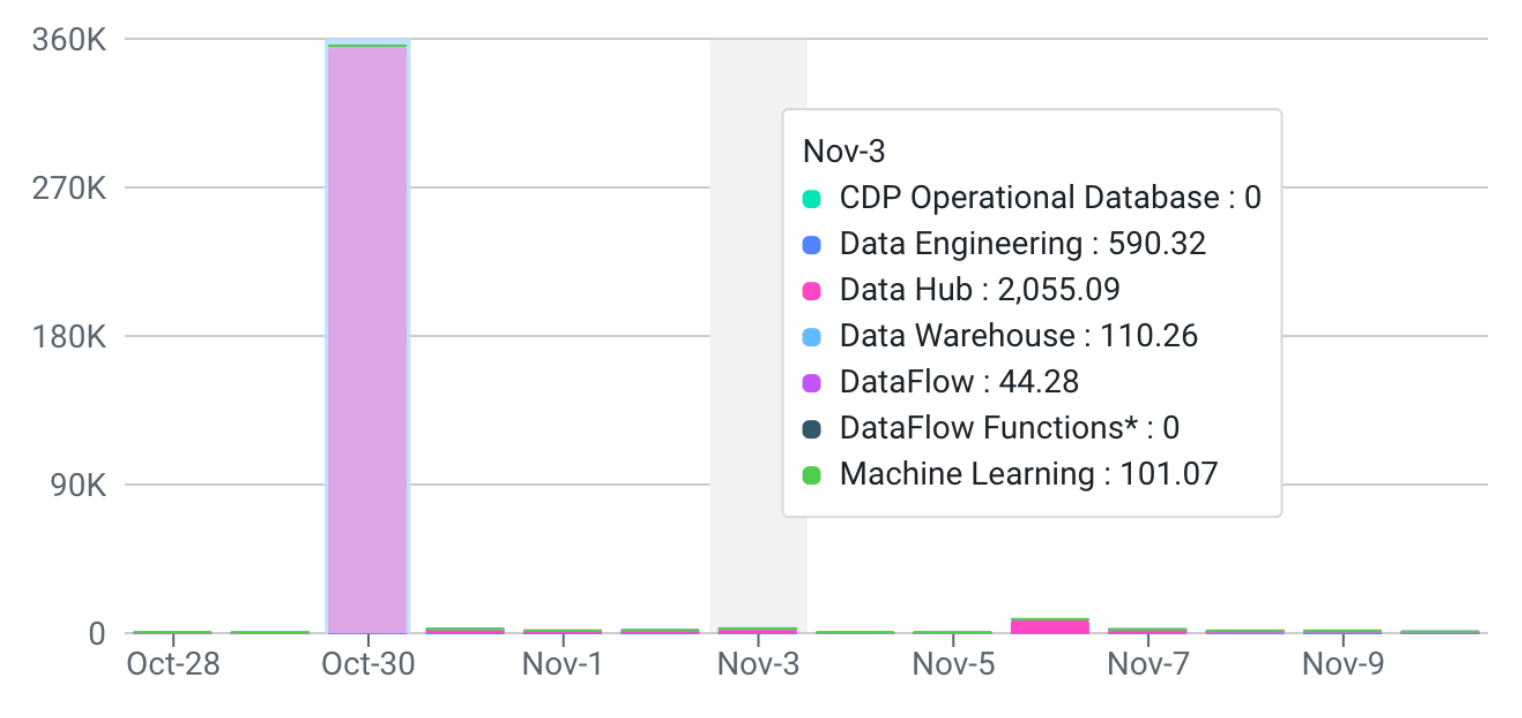
environment.Hover over a bar to display consumption information by services.To change the chart type, you can use the Chart Type
selector to change the visualization from a Bar Chart to
a Line Chart or a Pie Chart.
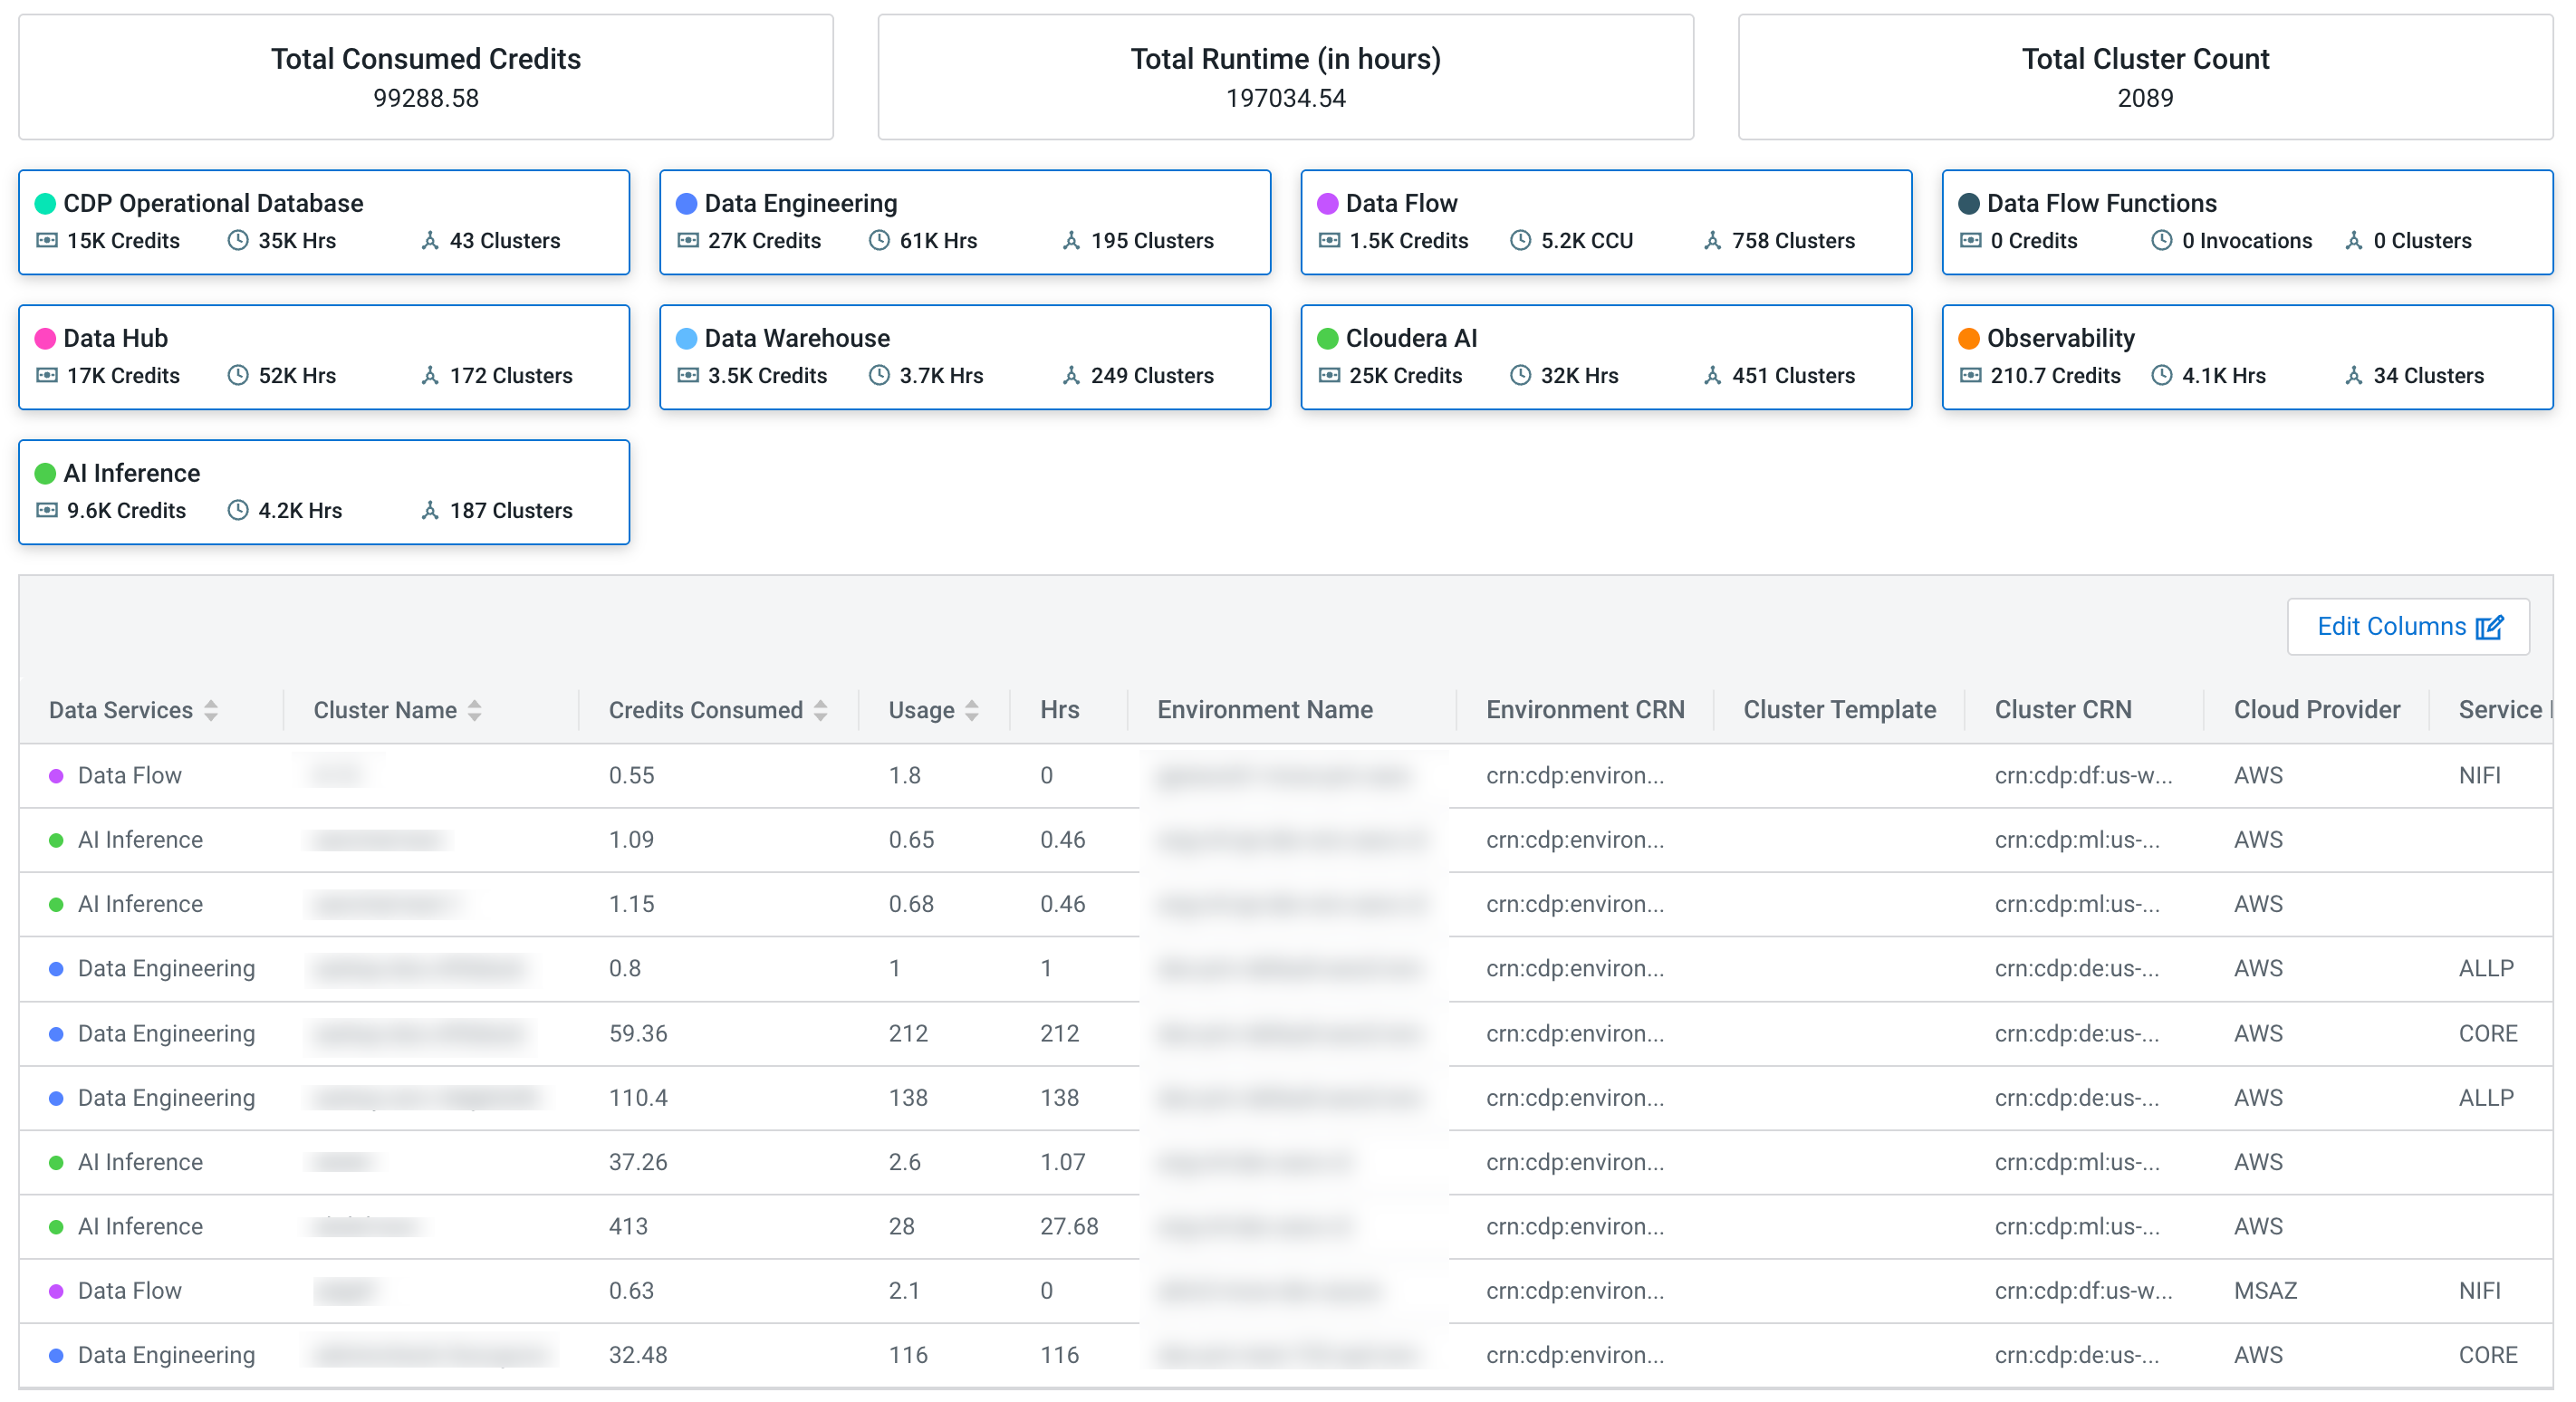
Clusters section
Under the Clusters section, you can use the Data Service
tiles to further filter down the information for the number of Consumed Credits used
by the clusters, total of hours the cluster was running, and how many clusters
belong to the specific services.You can view credit and usage information of clusters that belong to all
services or a specific service. By default, all Data Service tiles are selected. You
can deselect one or more of them based on your requirements. The Cluster section
uses the same filters as applied in the Usage Insights. Only those tiles will be
visible in the Clusters section, which have been selected in the filter dropdown of
the service. Clusters can also be searched by providing their name in the search
field. Using the Edit Columns button, you can choose which
columns should appear in the clusters table and you can reorganize the order of the
columns. The table will keep the customized view until you refresh the consumption
page.
In case telemetry is enabled for the cluster, you can also click on the name of
the cluster to open Cloudera Observability for a detailed view.
Download consumption summary from Cloudera web
interface
Use the Download Usage Details option to download the consumption data:
Download consumption summary from CDP CLI
Use the cdp consumption list-compute-usage-records command to download the
consumption data. For example:
To set page size (the number of records you want on one page), add the --page-size
<value> option to the above command..
To set page token (which signifies which page you would like in the response), add the
--starting-token <value> option to the above command. You will get the
starting token for the next page in the response of the previous page.