Specifying a time range

Enable a more in-depth analysis about your costs and workloads by displaying current or historical data for a specific time period.

Describes how to change the currently displayed time period from the time-range list, which appears on the Cluster Summary, Engine Summary, and Workload Summary pages.
By default, Cloudera Observability On-Premises displays workload data for the last 24 hours. If there is no data available during that time, Cloudera Observability On-Premises displays the nearest date range that is available.

The following steps describe, with examples, how to change the time period from the Cluster Summary page.

  1. Verify that you are logged in to the Cloudera Observability On-Premises web UI.
    1. In the URL field of a supported web browser, enter the Cloudera Observability On-Premises URL that you were given by your system administrator and press Enter.
    2. When the Cloudera Observability On-Premises Log in page opens, enter your Cloudera Observability On-Premises user name and password access credentials.
    3. Click Log in.
      The Cloudera Observability On-Premises web user interface landing page opens, which by default displays the Analytics Environments page that lists your Workload cluster environments.
    4. From the Environment Name column in the Environment's table, select the environment required for analysis.

      The Environments navigation panel opens, which hierarchically lists the environment's cluster, engines, and if applicable the Hive Metastore category.

  2. Depending on the environment selected, verify that the Cluster Summary page is displayed for the environment's cluster required for analysis.
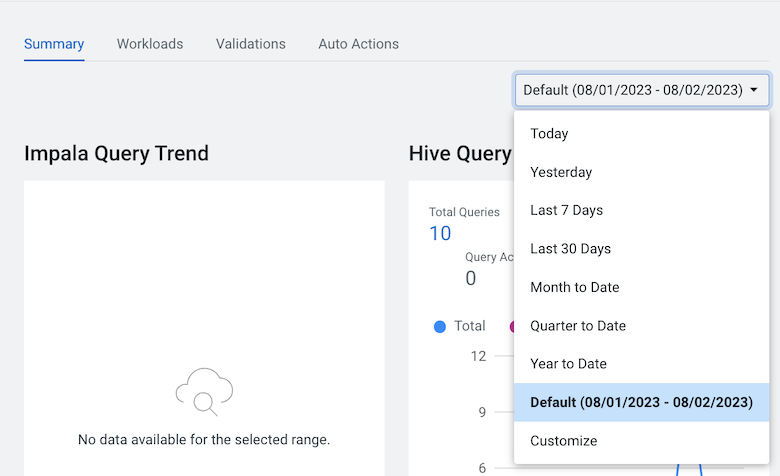
  3. From the time-range list, do one of the following:
    • For a predefined period, select one of the default periods of time that meets your requirements.
    • For an exact date and time range, select Customize and then either, enter the date and time range using the YYYY/MM/DD HH:MM:SS format for the beginning and the ending time period, or in the calendar element, select the beginning and ending time period.
    The following image shows an example of the time-range list on a Cluster Summary or Engine Summary page:
    Figure 1. Analytics time-range list


  4. Click Ok, which clears any existing workload data from the chart and table components and updates your workload data for the chosen time period.
All charts and tables in Cloudera Observability On-Premises are updated to reflect the workload data for the chosen time period.