This task describes how to manually define your Workload
Views.
Verify that you are logged in to the Cloudera Observability On-Premises web UI.
In the URL field of a supported web browser, enter the Cloudera Observability On-Premises URL that you were given by your system
administrator and press Enter.
When the Cloudera Observability On-Premises Log in page opens, enter your Cloudera Observability On-Premises user name and password access credentials.
Click Log in.
The Cloudera Observability On-Premises web user interface landing page opens,
which by default displays the Analytics Environments page that lists
your Workload cluster environments.
From the Environment Name column in the
Environment's table, select the environment required for analysis.
The Environments navigation panel opens, which hierarchically lists
the environment's cluster, engines, and if applicable the Hive
Metastore category.
Depending on the environment selected, verify that the Cluster
Summary page is displayed for the environment's cluster required
as a workload view.
Select the Workloads tab.
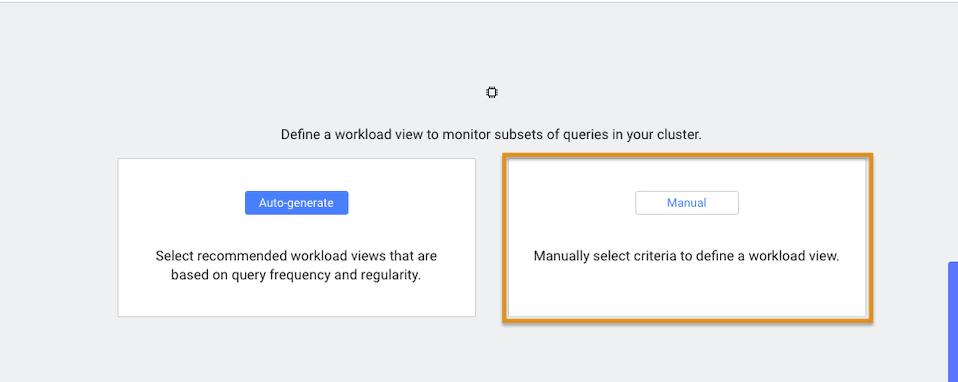
In the Workloads page, click Manual:
The Criteria Definition widget opens, where you define
a set of criteria that enables you to analyze a specific set of queries.
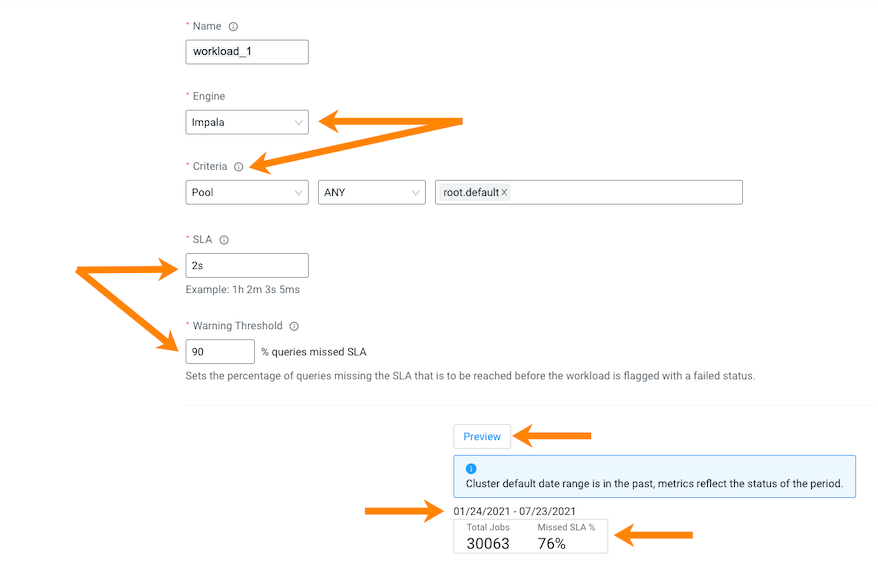
For example, as shown in the image below, you can list the total amount of
failed queries, as a percentage, from a specific engine that are subject to a
two second SLA.
Where, as defined by the criteria condition, Cloudera Observability On-Premises will
monitor all query jobs from the Impala engine. When the
total query execution time exceeds 2 seconds, as defined by the SLA condition,
for 90 percent of these queries, as defined by the Warning Threshold, the
workload is flagged with a failed state:
Optional: To display a summary of the queries matching your criteria, click
Preview. The date range, the number of queries that
match the criteria, and the number of queries that missed the SLA condition are
displayed.
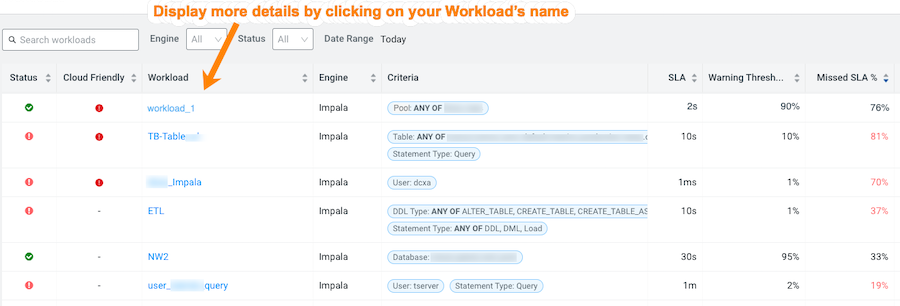
Click Save.
The Workloads page opens and your workload view appears in the
Workload column.
Optional: To view more information about the workloads using the view's formula, open its
Summary page by clicking the name of the workload view in the
Workload column, which displays the view's details as
chart widgets that you can use to further analyze the results.
Optional: To create a new view do the following:
Verify that the Cluster Summary page is displayed
for the environment's cluster required as a workload view.
Select the Workloads tab.
From the Define New menu in the Workloads page,
select one of the following:
To create a new manual view, select Manual
Definition, in the Criteria
Definition widget define a set of criteria for
the view, and then click Save.
To automatically generate a new view, select
Auto-generate Definition.
The Workloads page reopens and your workload view appears in the
Workload column.
Workload Views cannot be edited directly. If you require changes to an existing
Workload View do the following:
In the Workloads page, Locate the Workload View that requires
changes.
From its Action list, select Clone.
In the Criteria Definition widget make the
changes you require, and then click Save.
The Workloads page reopens and your workload view appears in the
Workload column.
Locate the Workload View that required changes and from its Action
list, select Delete and then in the Confirm
message, confirm its deletion by clicking
OK.