Distributing the Cloudera Observability On-Premises components
Horizontal scaling improves performance by enabling multiple devices to share the processing and memory workload. Cloudera recommends that you leverage the Cloudera Observability On-Premises cluster resources by installing its components as described.
- One node must include all the Cloudera Observability On-Premises component role types.
- The Databus API Server, Databus Server, Analytic Database Server, Baseline Server, Entities Server, SDX Server, and Pipelines Server role types can scale out to multiple nodes. As listed in the Node 2, 3, and 4 columns.
- Due to inter service dependencies, the following role types are grouped.
Where, if one of the components is on a host then all the other components
in that group must be on the host, which is enforced by Cloudera Manager:
- Databus API Server and Databus Server.
- Analytic Database Server, Baseline Server, Entities Server, SDX Server, and Pipelines Server.
- Admin API Server, API Server, and Console Server.
For example, if you add a new Databus API Server, you must also add a Databus Server to that node.
- Configure multiple Phoenix Query Server hosts, which reduces bottlenecks.
Where, the number of Phoenix Query Server hosts should be proportional to
the number of Cloudera Observability On-Premises roles.
For example, if you have roles on 5 nodes, at least 5 Query Servers are recommended for Phoenix. Cloudera Observability On-Premises internally balances loads on those hosts.
| Service | Node 1 (All master components of all services) |
Node 2, 3, 4 (Worker nodes + ZooKeeper + Cloudera Observability processing components) |
Node 5 (Worker nodes + Cloudera Observability processing components + Cloudera Observability UI ) |
|---|---|---|---|
| Cloudera Management |
|
||
| HBase |
|
|
|
| HDFS |
|
|
|
| Hive |
|
|
|
| Hue (Optional) |
|
||
| Impala |
|
|
|
| Kafka |
|
||
| Phoenix |
|
|
|
| Observability |
|
|
|
| ZooKeeper |
|
-
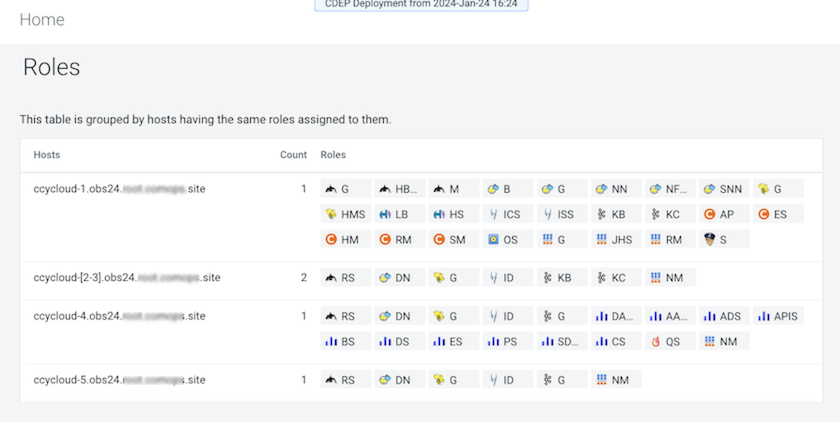
In Cloudera Manager, select Hosts and then
Roles.
The roles assigned to each node appear as shown in the below example: