Monitoring table maintenance tasks on Cloudera Observability dashboard

You can monitor the maintenance actions of Cloudera Lakehouse Optimizer policies as Spark jobs on Cloudera Observability dashboard. The maintenance actions are sent to the Spark engine through Livy in the order as specified in the JEXL script of the policy.

For each maintenance action, the Spark engine spawns a set of Spark jobs. Each Spark job contains Cloudera Lakehouse Optimizer maintenance action-specific details which you can view on the Spark Application > Job details page.

For information about Cloudera Lakehouse Optimizer, see Cloudera Lakehouse Optimizer for Iceberg table maintenance.
  1. Go to the Cloudera Observability > Environments page.
  2. Select Lakehouse Optimizer from the All Environments list.
  3. Select an environment.
    The Environment navigation panel opens, which hierarchically lists the environment and its services hosted on the selected environment.
  4. On the left navigation pane, click Engines > Spark.
    The monitoring widgets appear.
  5. Click the required Livy job in the Jobs widget. A Livy session corresponds to a Spark application.
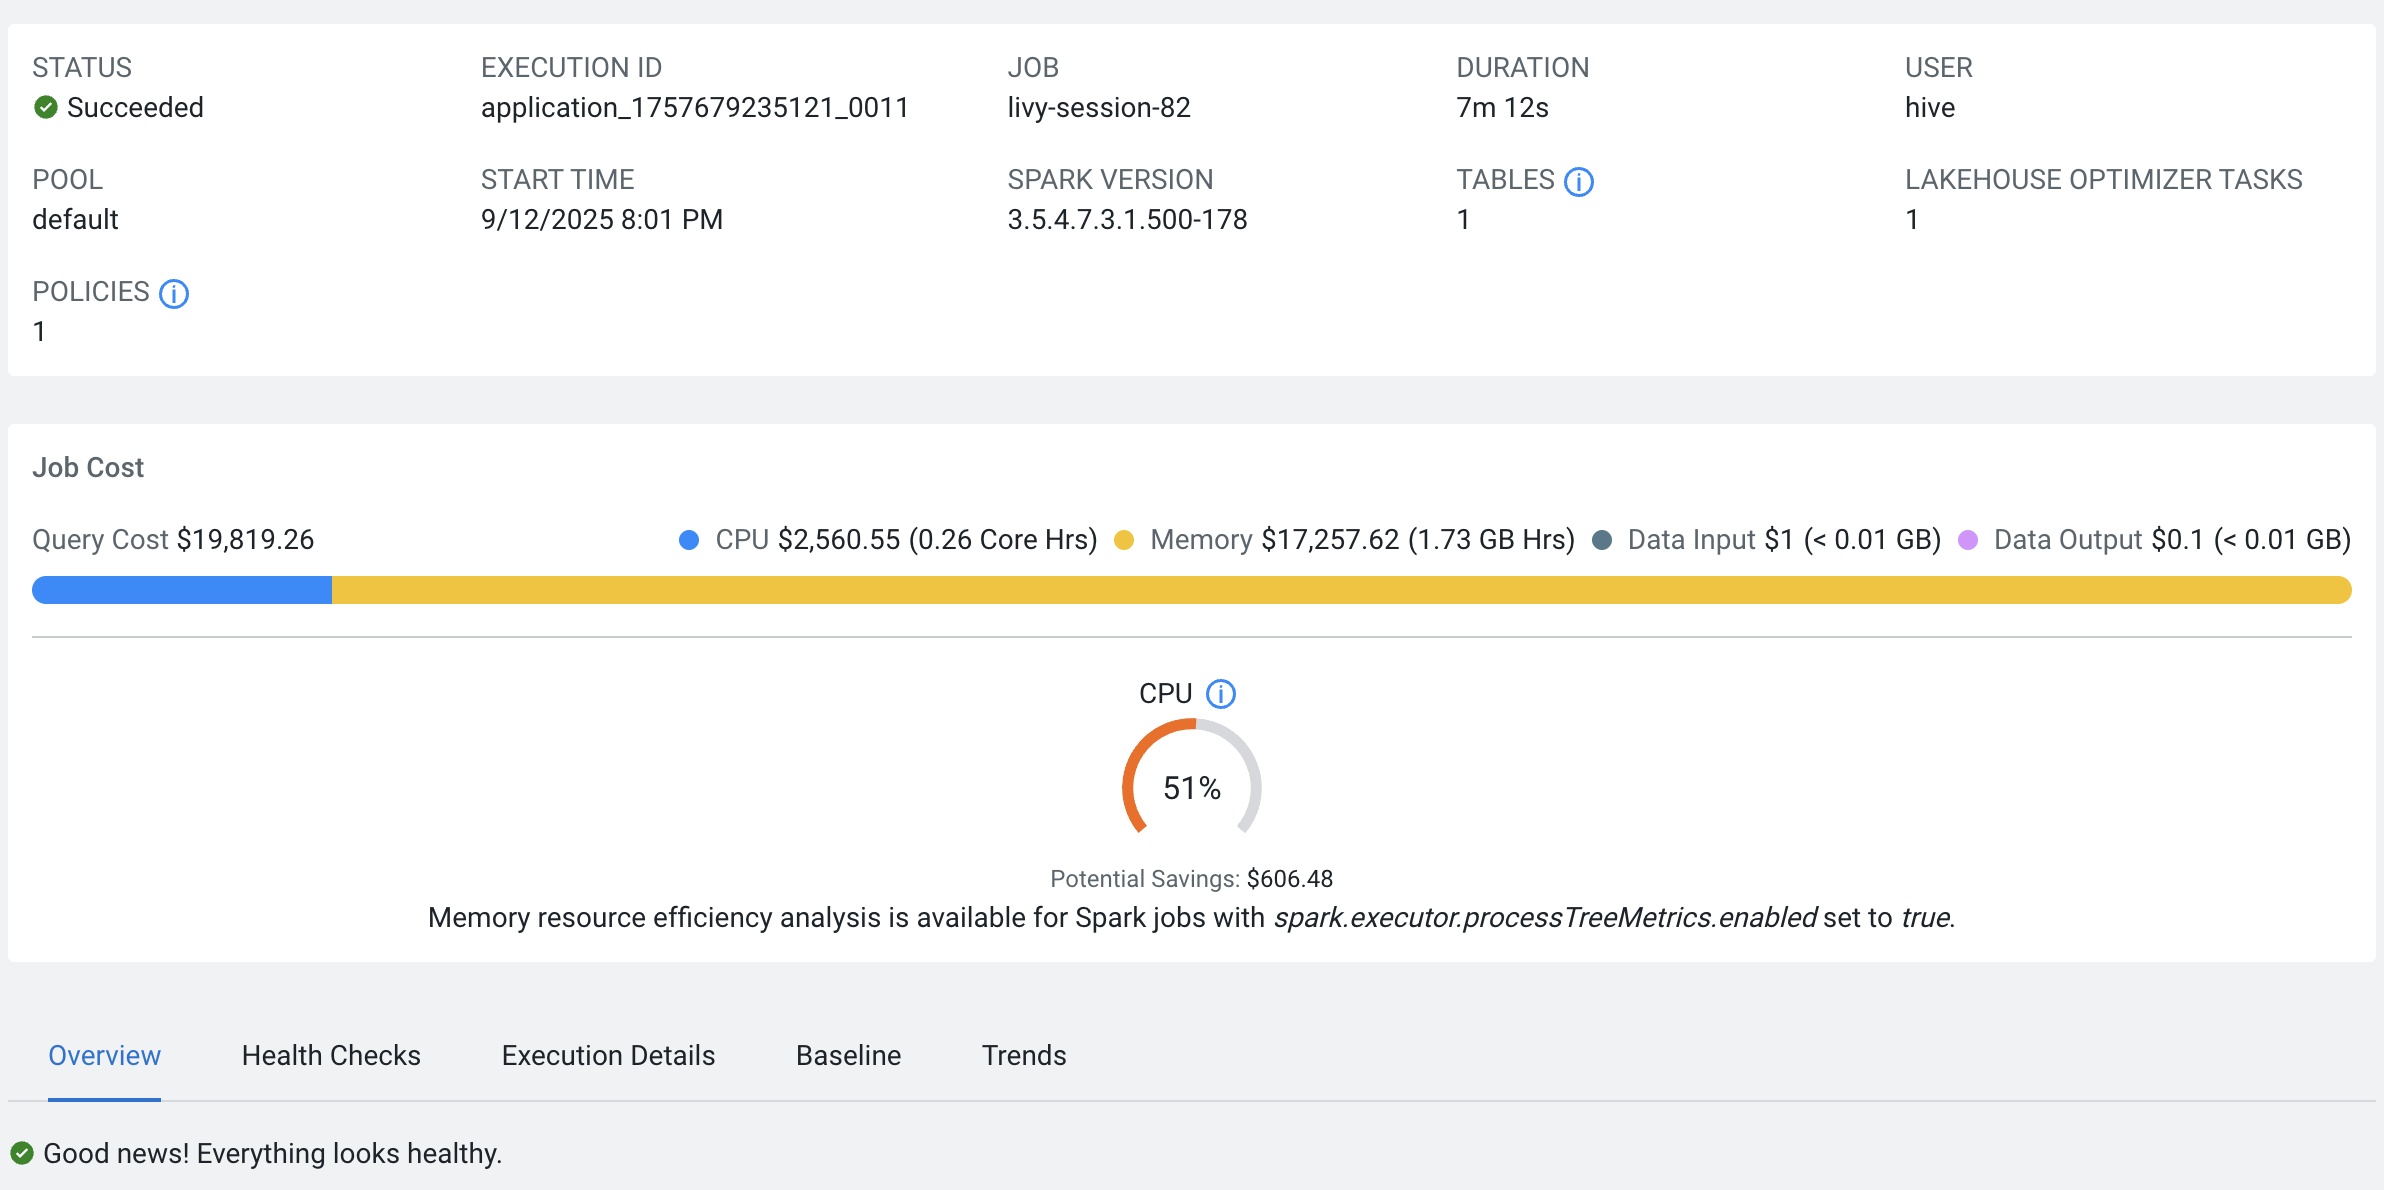
    The Job Details page shows the STATUS, EXECUTION ID, JOB ID, DURATION of the job run, USER running the job shows hive, POOL, START TIME of the job, Iceberg TABLES under maintenance, the number of LAKEHOUSE OPTIMIZER TASKS running in the Spark application, and the number of POLICIES as shown in the following screenshot:
    The image hows the Lakehouse Optimizer subsection in the Summary section.

    If there are no details available about the policy, table, or task in the job, the Job Details page does not display those fields.

  6. To view the metrics for the job, perform the following steps:
    1. Click the Execution Details tab on the Job Details page.
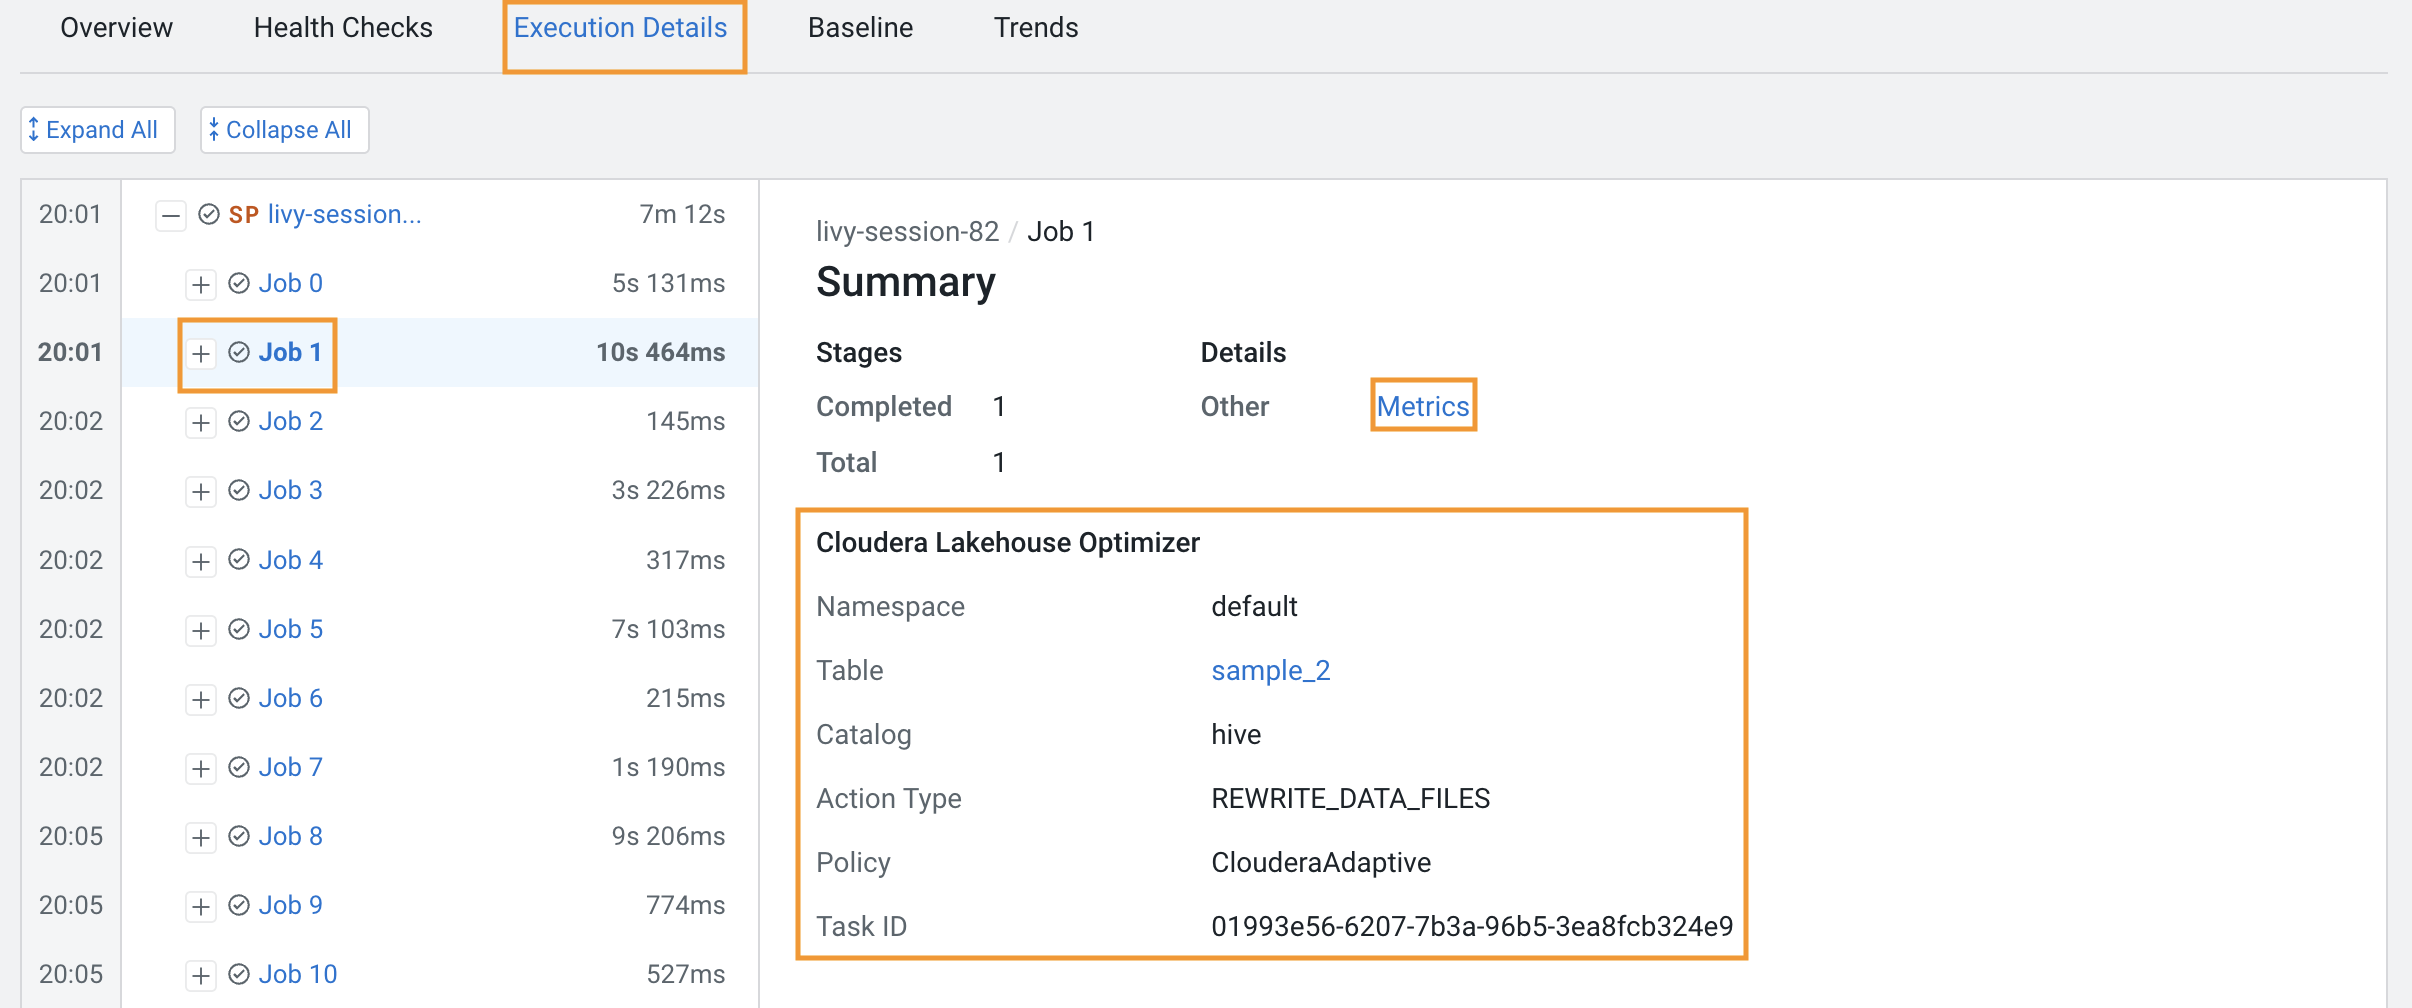
    2. Click Metrics to view more details about data consumption and other related information as shown in the following screenshot:
      The following screenshot appears which shows the Lakehouse Optimizer subsection in the Summary section:
      The image hows the Lakehouse Optimizer subsection in the Summary section.
    3. Click the table name to view the Overview Details in a side panel.