Describes the fields in the Auto Actions Events and Management pages of Cloudera Observability.
The Events and Management pages help you monitor, manage, and troubleshoot your Auto
Actions.
Events
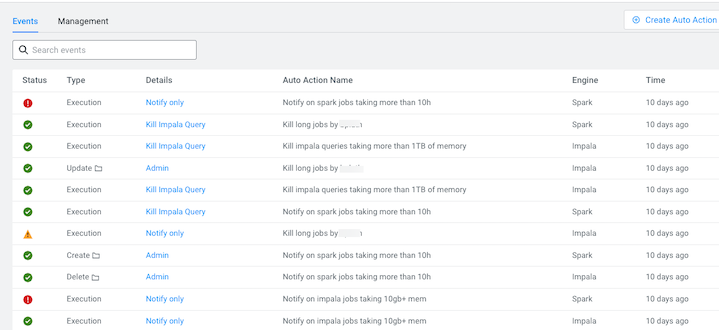
The Events page displays information about your auto action audit
events:
It contains the following audit entry fields:
Status, which displays the results of the auto action event as an
icon. Where, green indicates that the action was successful (SUCCEEDED). All the other icons
indicate that the action was unsuccessful (FAILED).
Type, which displays the auto action's audit event category type,
such as Create or Update.
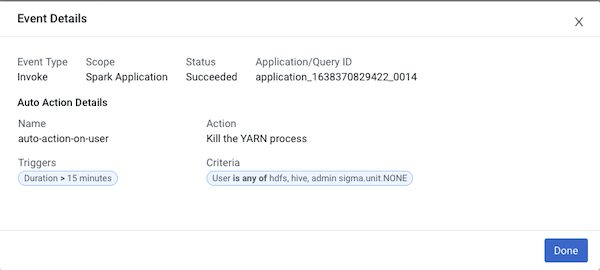
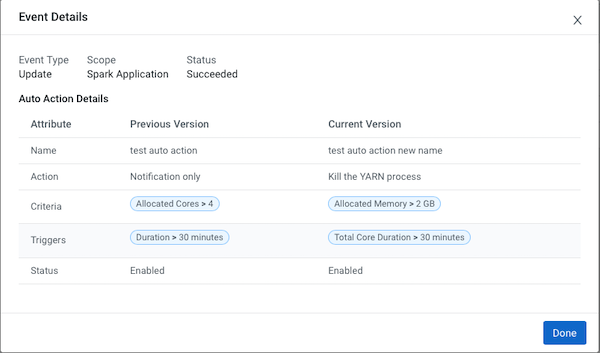
Details, which displays the type of action. When clicked the auto
action’s Event Details audit log opens, as shown in the following
Invoke and Update event type example images:
Figure 1. Invoke Event Type Example
Figure 2. Update Event Type Example
Auto Action Name, which displays the unique name you entered for the
auto action.
Scope, which displays the workload component service that is
monitored by the action.
Time, which displays the time stamp of when the auto action's audit
event occurred.
Management
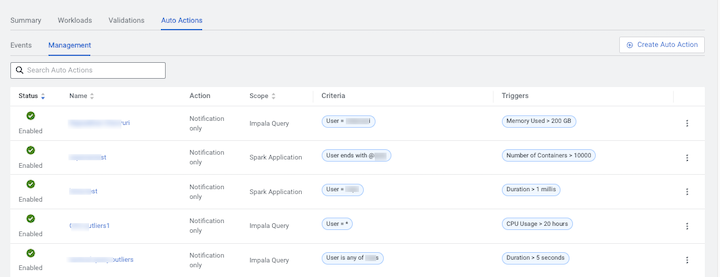
The Management page displays your auto action's defined settings and
state:
It contains the following entry fields:
Status, which displays the current state of the action, as either
Enabled or Disabled.
Name, which contains the name of the auto action. When clicked the auto
action's definition settings page opens.
Action, which displays the name of the action that is invoked when
the auto action is triggered, such as Notify Only.
Scope, which displays the workload component service that is
monitored by the action.
Criteria, which displays the action's Criteria filters. These are
attributes with static values that remain the same during the execution of a job or
query.
Triggers, which displays the action's Trigger conditions. These are
attributes with dynamic values that change during the execution of a job or query.