Troubleshooting failed jobs
You can identify and troubleshoot incomplete jobs on your cluster using Cloudera Observability.
Steps with examples from a Virtual Cluster's Spark engine are used to describe how to further investigate and troubleshoot the root cause of a job that failed to finish.
-
To view more details about why a job failed to complete, from the
Job column select a job's name. The job's page opens
displaying information about the job you selected and where the failure
happened.
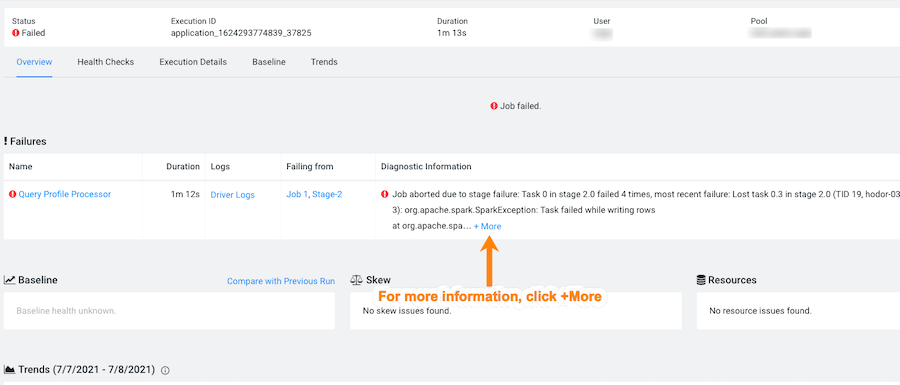
-
From the Failures section in the Diagnostic
Information column, click More.
The Diagnostic Information dialog box opens, which describes more details about why the job aborted. In the following example, the job was aborted whilst writing rows due to an out of bounds java exception:
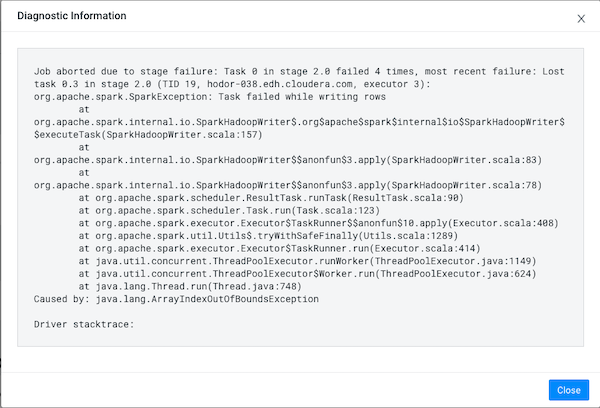
-
To display more information about the stage where the job failed, in this case
the Stage-2 process, in the Failing
from column, click the stage's link. Or select the
Execution Details tab and then click the failed
stage's link.
In the following example's Summary panel, it shows that Task 0 was attempted 4 times:
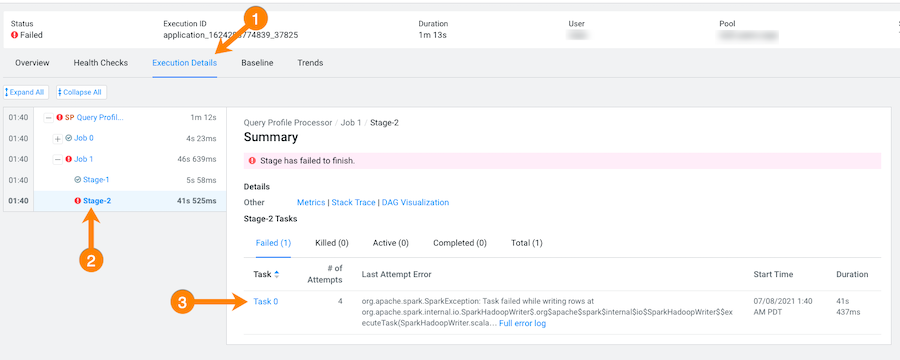
-
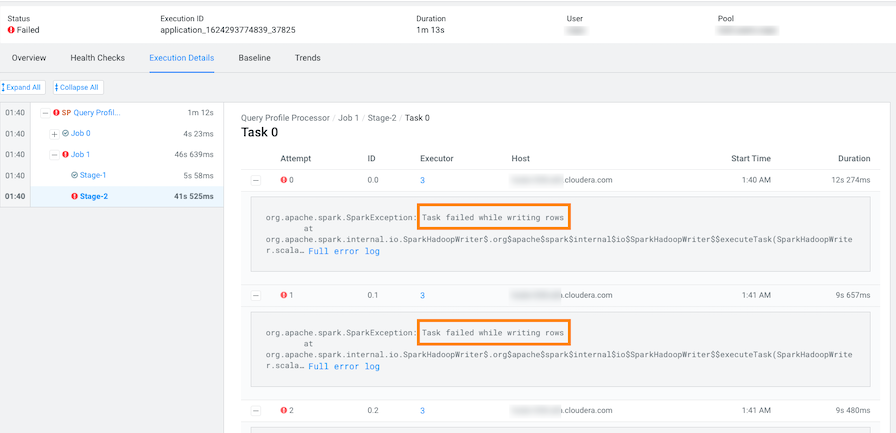
To display more information about all the failed attempts, in the
Summary panel, click the
Failed task value.
In the following example, the job aborted when Task 0 was writing rows. To understand more about what triggered the
SparkExceptionerror message and to further troubleshoot the root cause, you can open the associated log file by clicking Full error log.