Troubleshooting with the Job Comparison Feature
You can compare two different runs of the same job, which is especially useful when you notice unexpected changes, such as when you have a job that consistently completes within a specific amount of time and then it starts taking longer. Comparing two runs of the same job enables you to analyze the performance and differences so that you can troubleshoot the cause.
Steps with examples from a Virtual Cluster's Spark engine are used to explain how to use the job comparison feature for further investigation and troubleshooting.
-
Examine the list of jobs that have executed during the selected time period and
manually compare runs of the same job.
For example, as shown in the following image, when manually comparing the last two runs of the
Log Processorjob we can see that there are duration differences. In this example, the older run had a Task duration skew health issue, which appears to be fixed.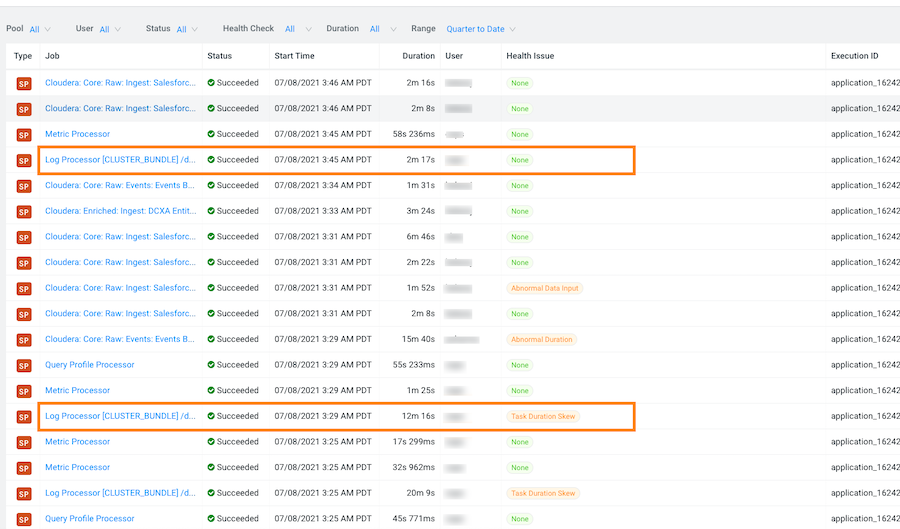
-
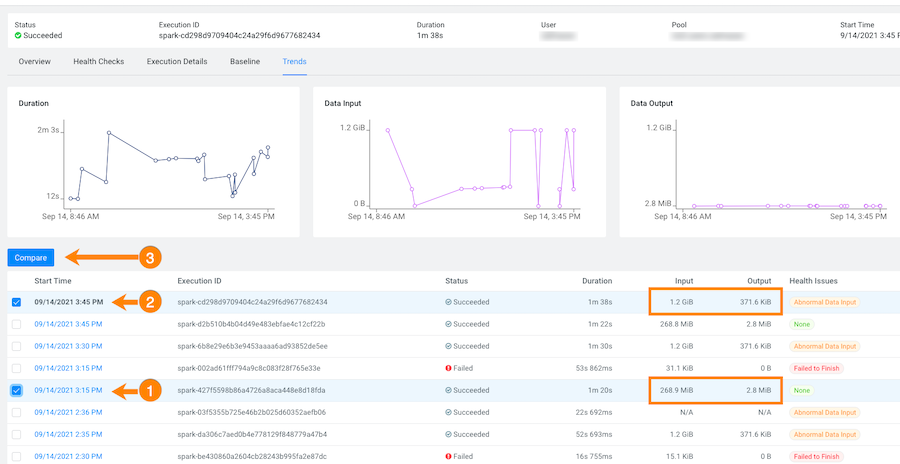
List and display details of all the runs of a specific job of interest by
selecting one of the job runs and then in its jobs details page, click the
Trends tab.
In the following example, notice how the amount of Input and Output data changes between runs. The Job Comparison tool enables you to examine more details about two runs to determine why the amount of data changed. In this case you can compare a run with no health issues with the last run of the job:
-
To compare two job runs, select the check boxes adjacent to the job runs you
require and then click Compare.
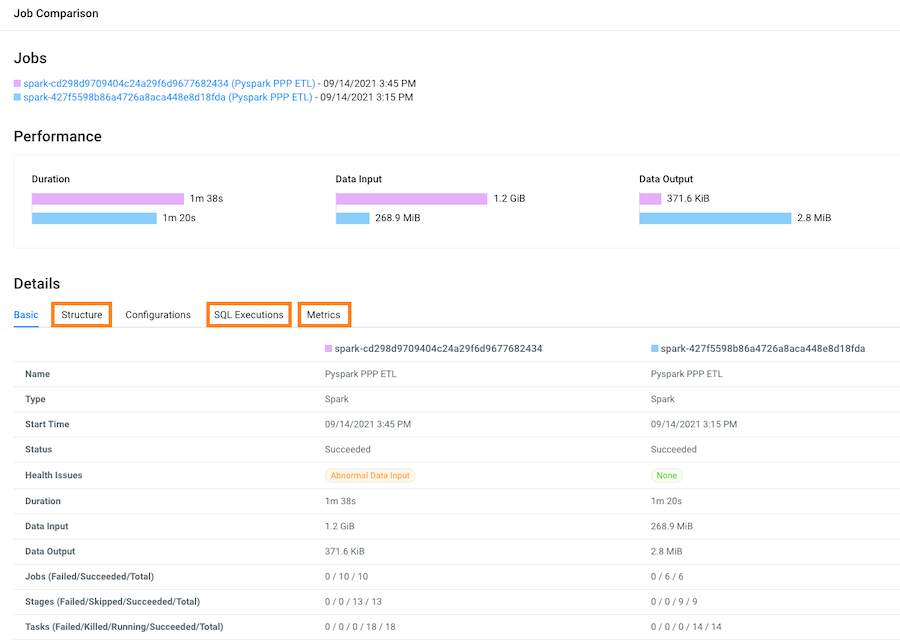
The Job Comparison page opens, displaying more details about each job.For this example's comparison, the tabs that contain more information about the job runs are the Structure, SQL Executions, and the Metrics tabs:
-
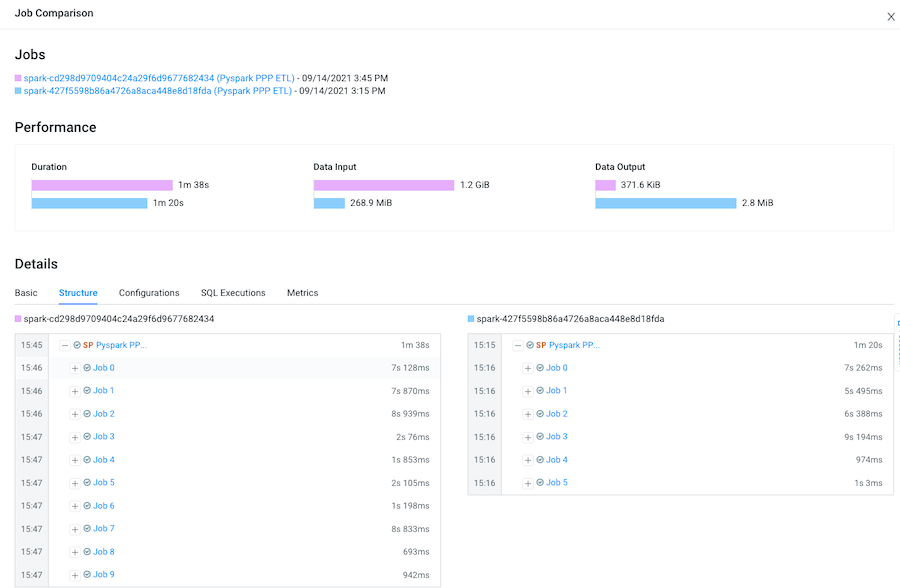
Display and compare the sub-jobs executed for both of your selected job runs by
selecting the Structure tab.
For example, as shown in the following image, the last run of the job (with health issues) completed in 1 minute and 38 seconds and executed 9 sub-jobs and the run that had no health issues took 1 minute and 20 seconds but only executed 5 sub-jobs. Clicking any of the listed sub-jobs displays more details.
-
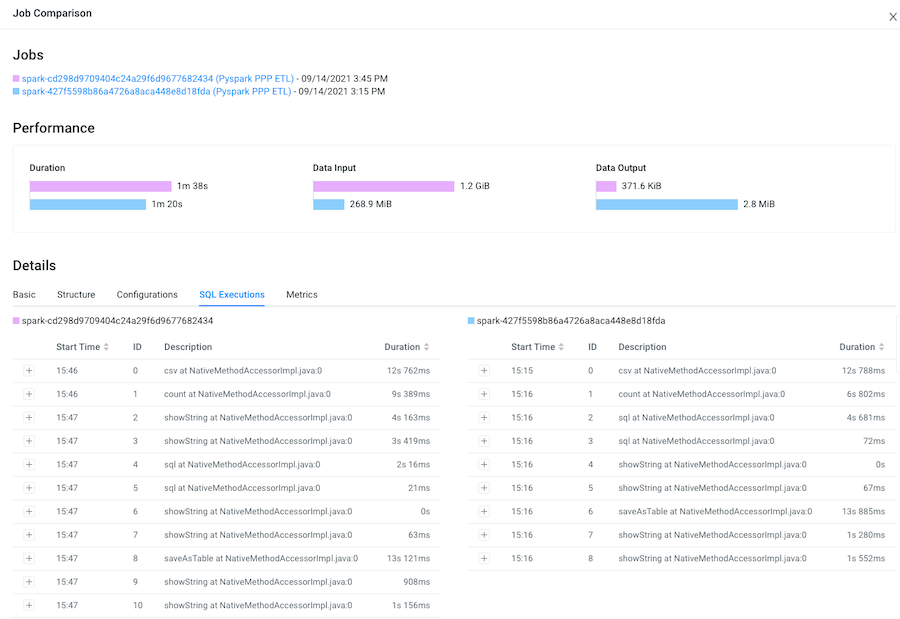
Display and compare Spark SQL queries that were run and how long they ran for
both of your selected job runs by selecting the SQL
Executions tab.
For example, as shown in the following image, more Spark SQL queries were run on the data in the last job run.
-
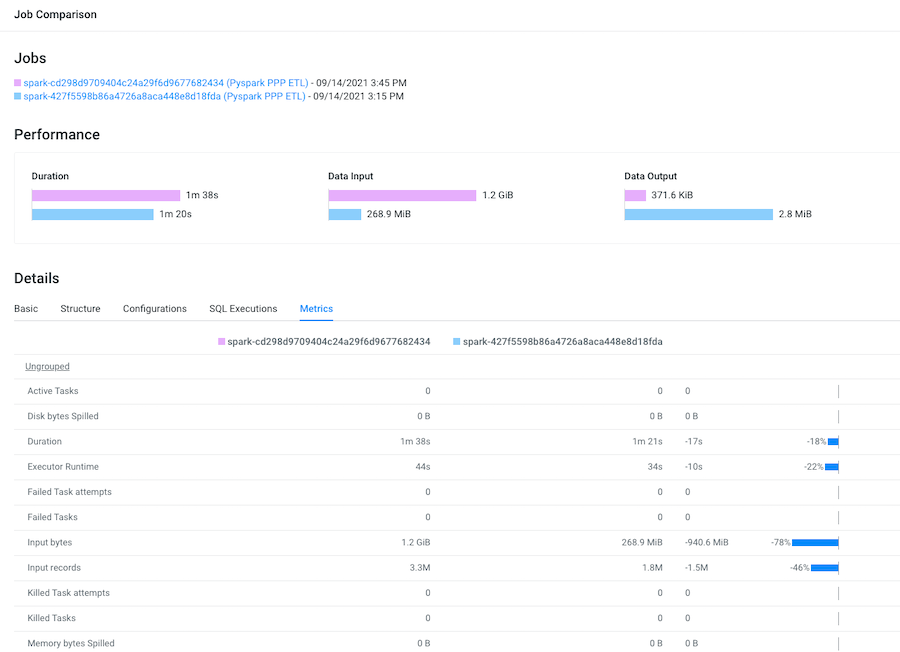
Display and compare what metrics were performed on both of your selected job
runs by selecting the Metrics tab.
For example, as shown in the following image, more input records were digested in the last job run.