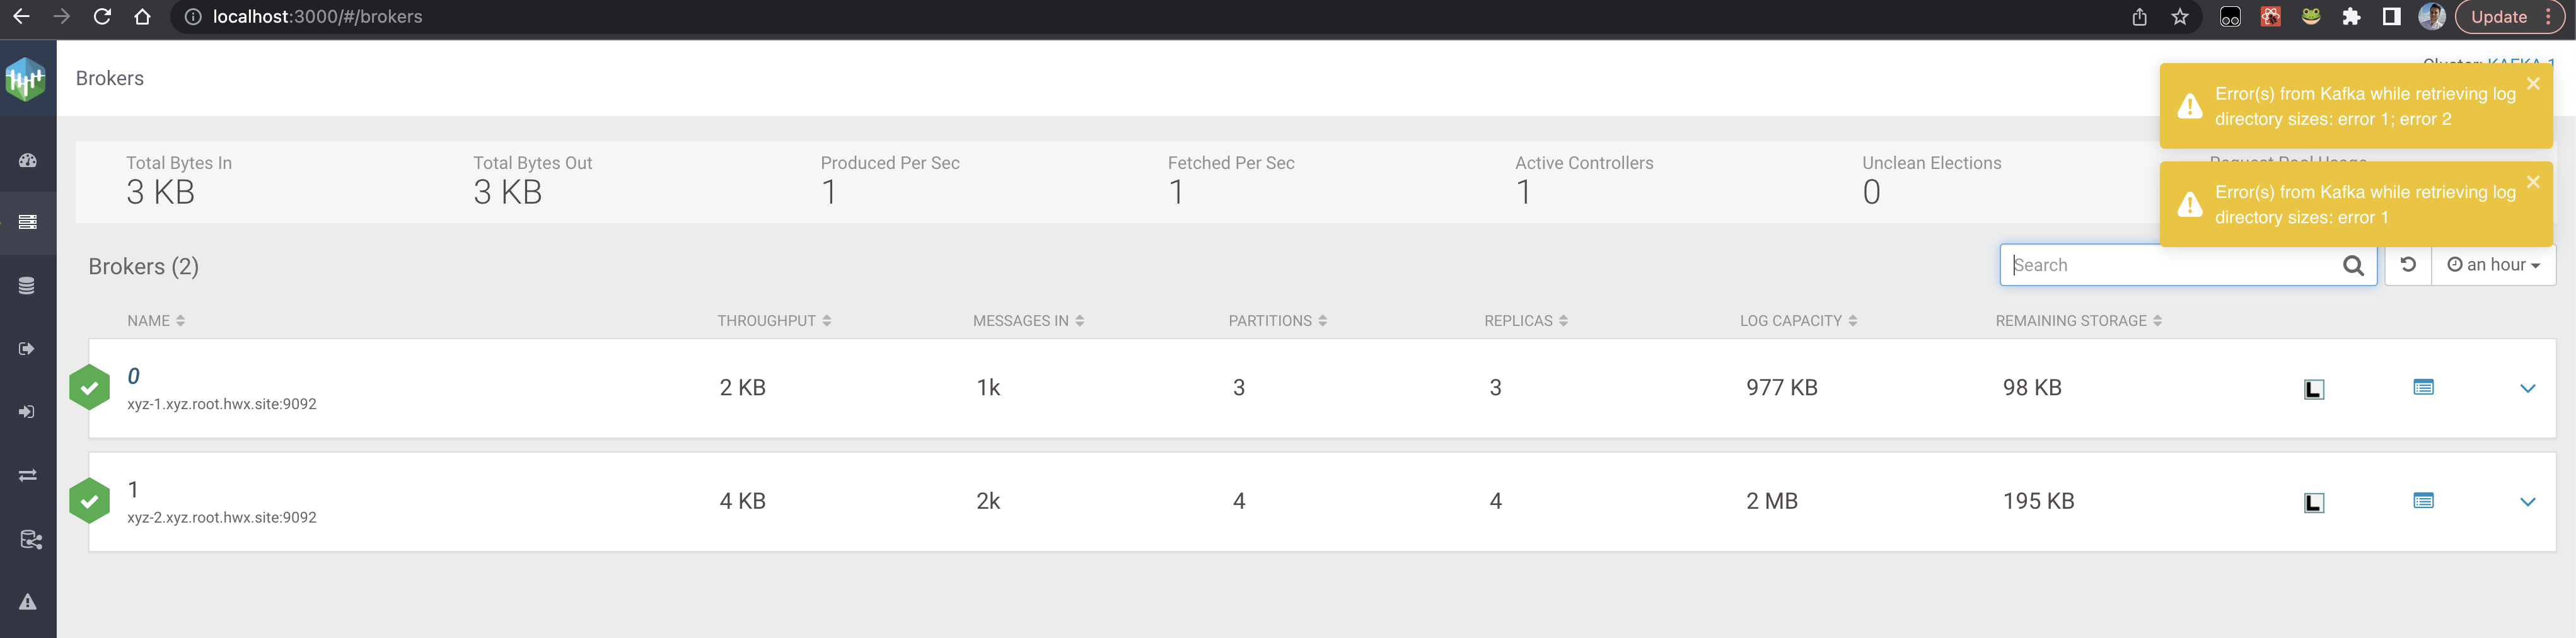
The SMM UI shows log size related information about brokers, topics, and partitions.
Furthermore, warning messages appear when log directory related errors happen.
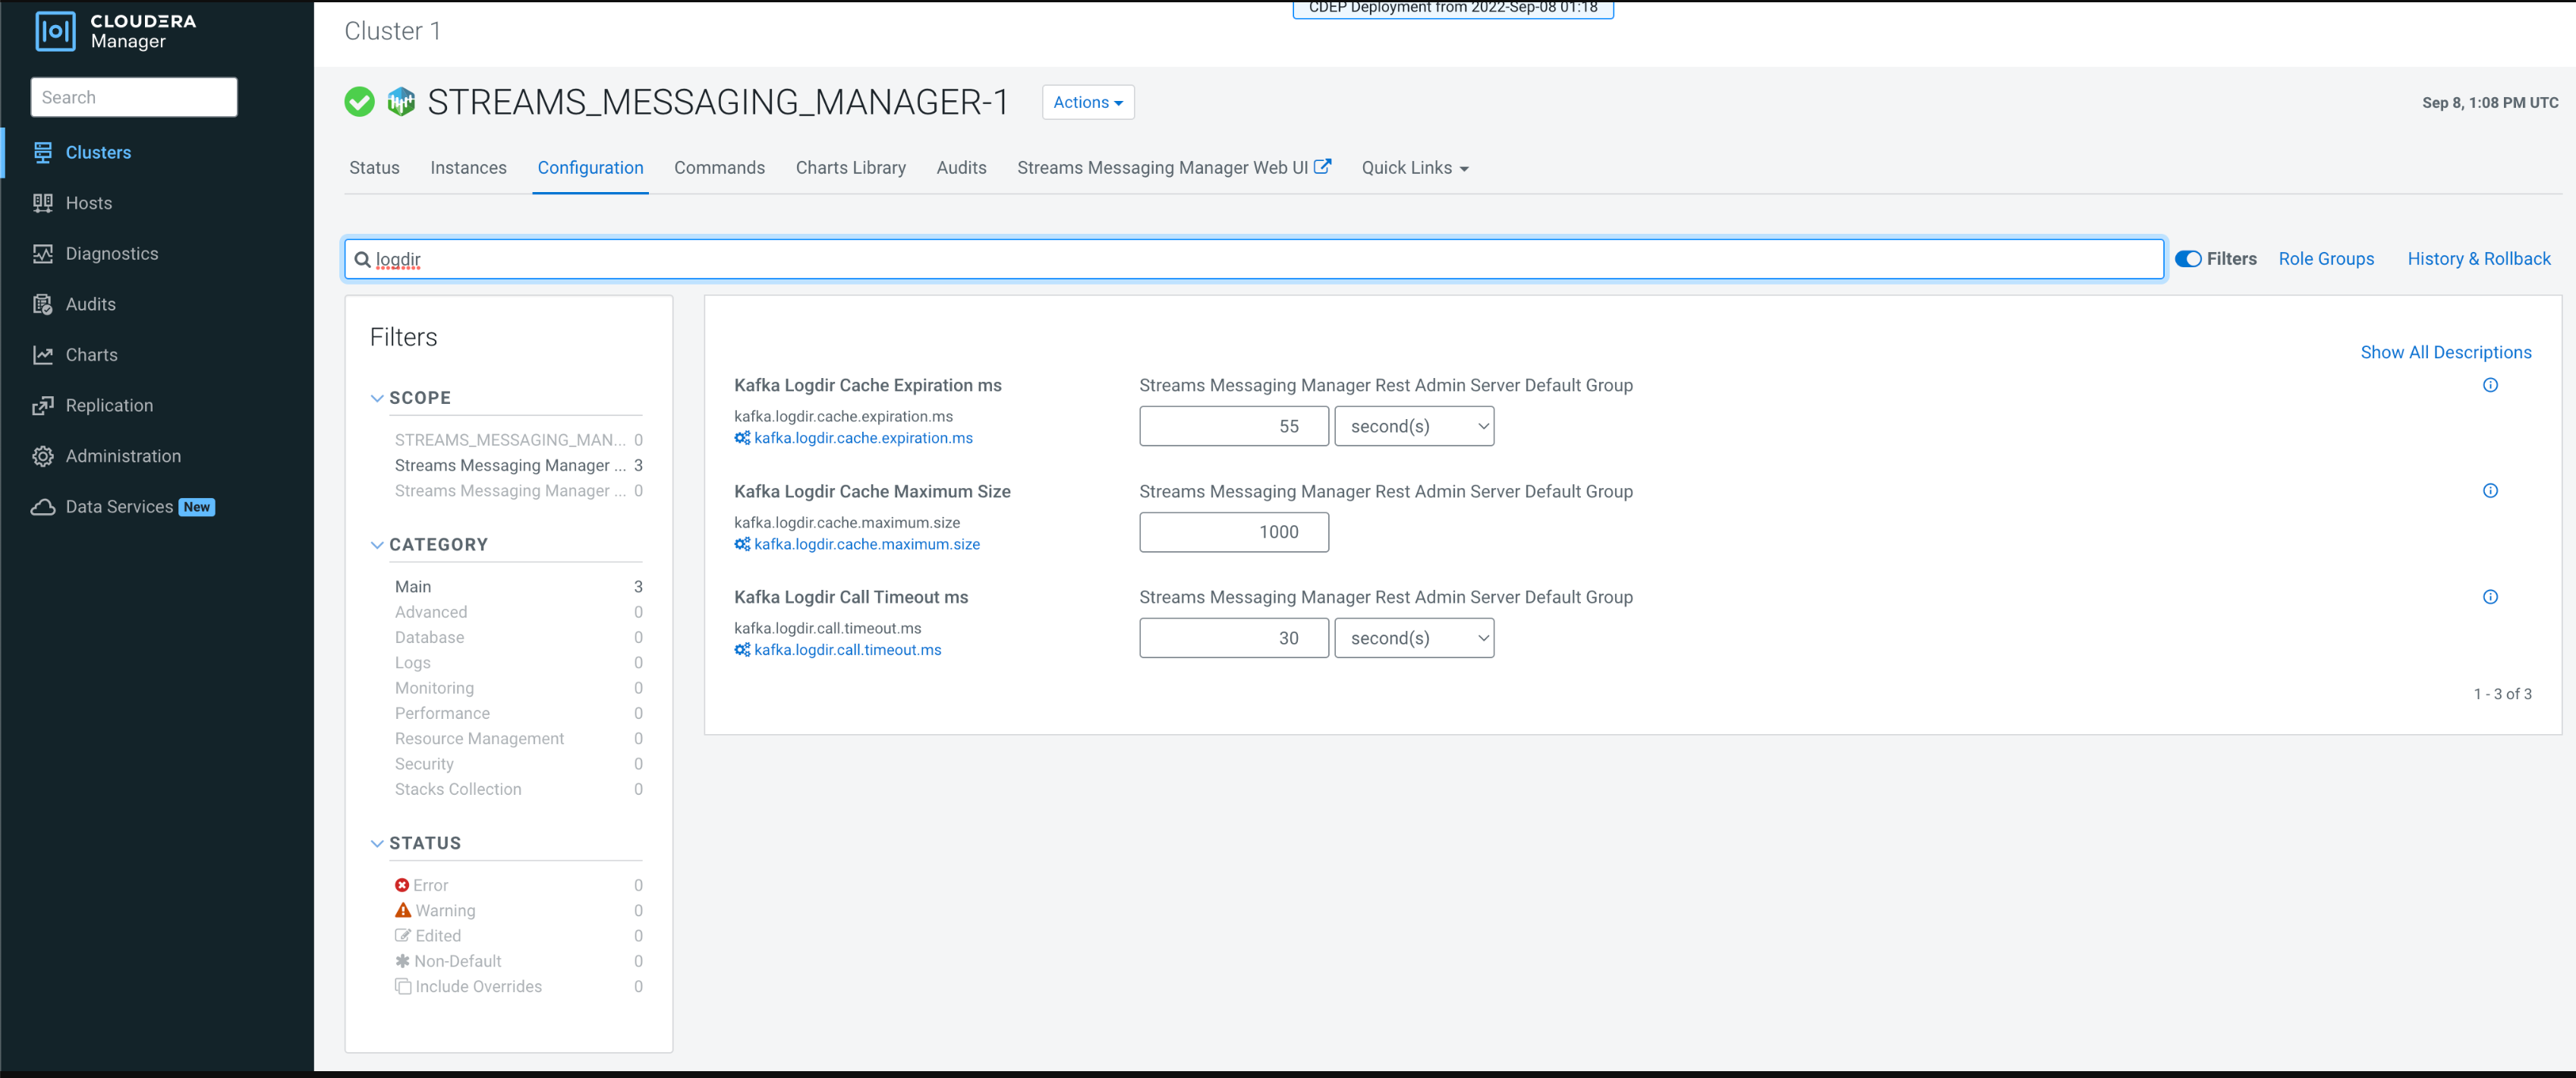
The feature uses a cache mechanism. The following cache attributes are set by default. You can
modify these attributes in the SMM configuration page of the Cloudera Manager UI:
Kafka Logdir Cache Expiration ms
Sets cache expiration time.
Kafka Logdir Cache Maximum Size
Sets maximum cache size.
Kafka Logdir Call Timeout ms
Sets timeout of the Kafka query.
The following image shows the properties in Cloudera Manager:
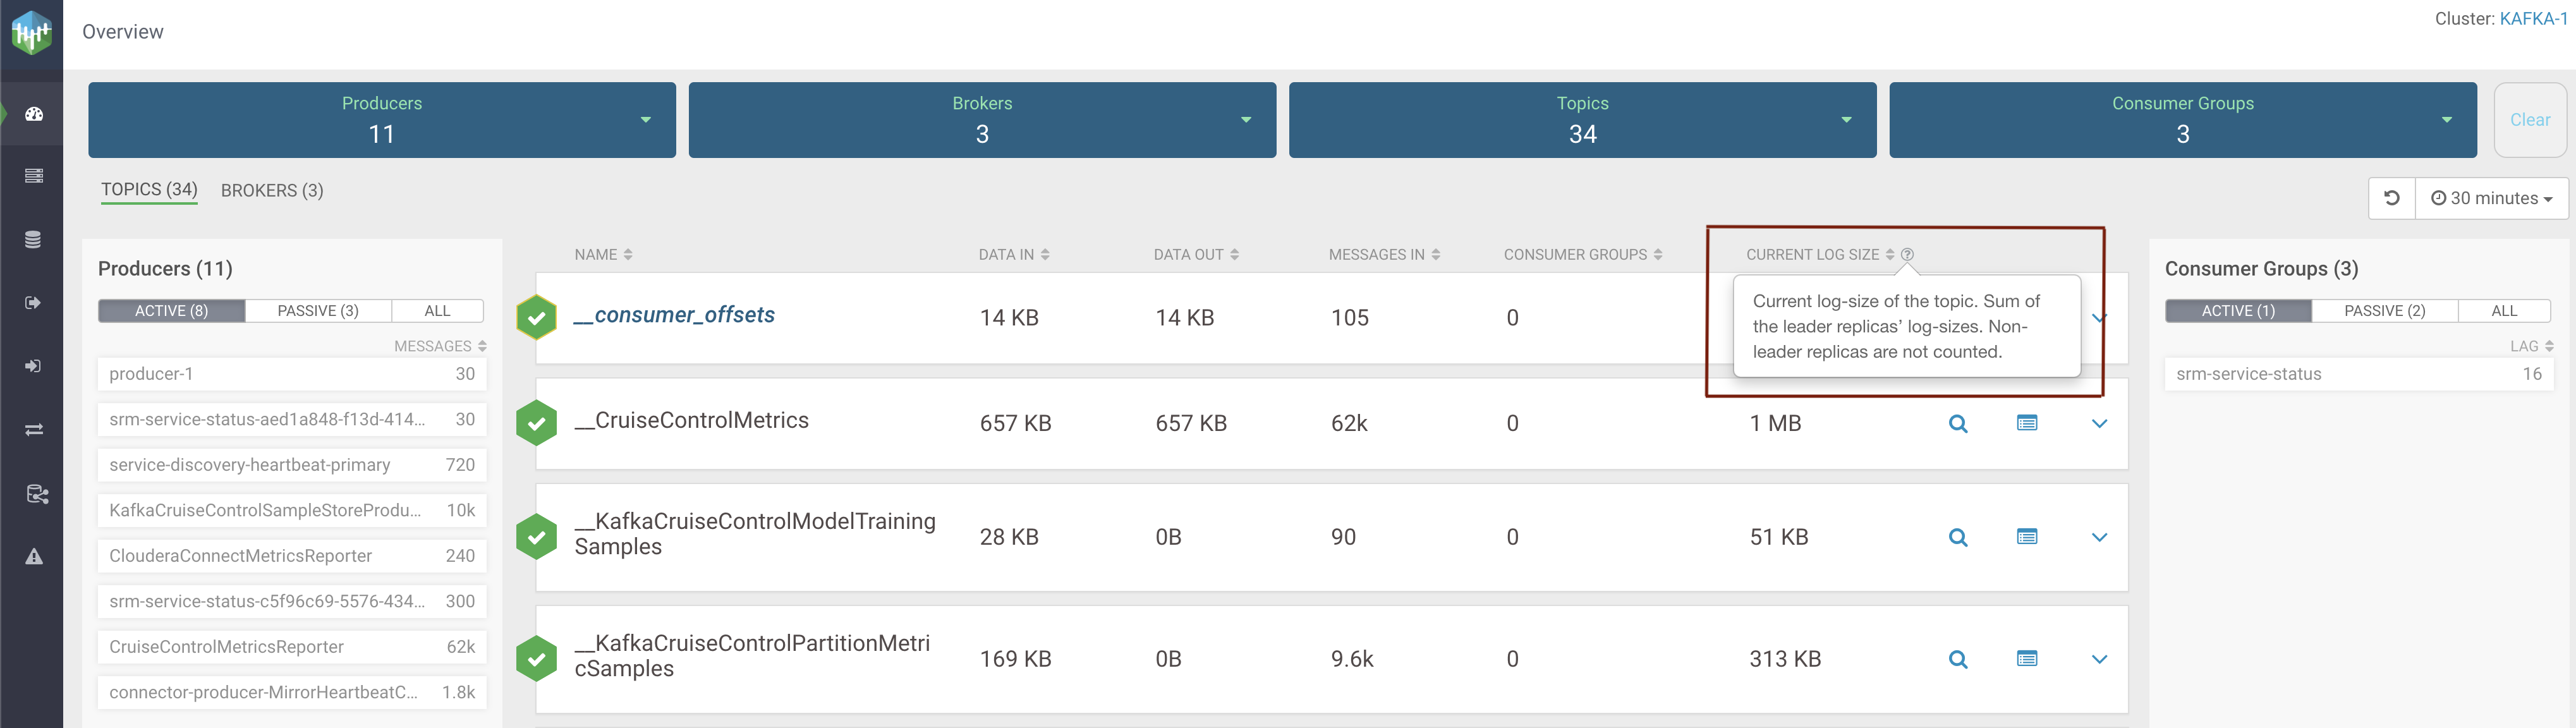
Log size details for topics
On the Overview page of the SMM UI, the
Topics tab contains a sortable column called Current
Log Size which shows the data with the measure unit. This log size is
calculated by the leader partitions; so, the follower partitions are not included. The
column contains a tooltip which is a question-mark symbol. The topic related log-size
improvements or information are also available on the Topics
page.
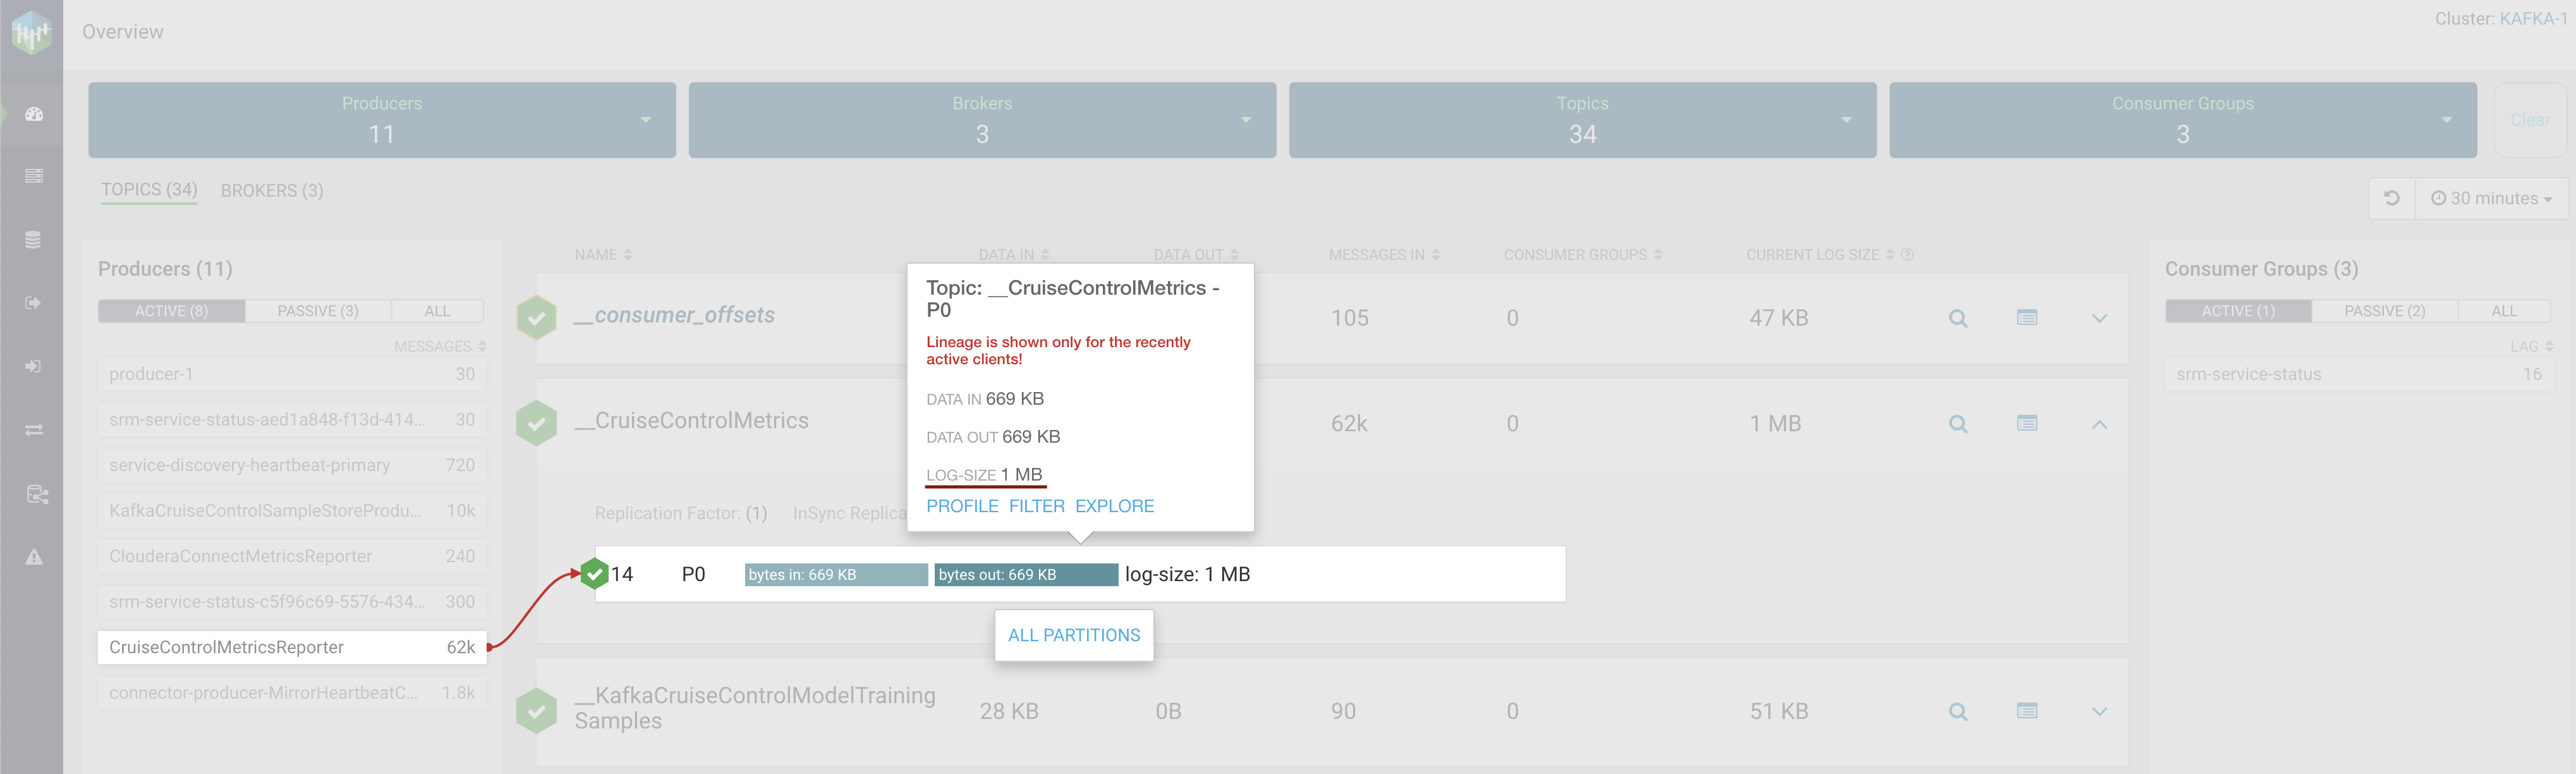
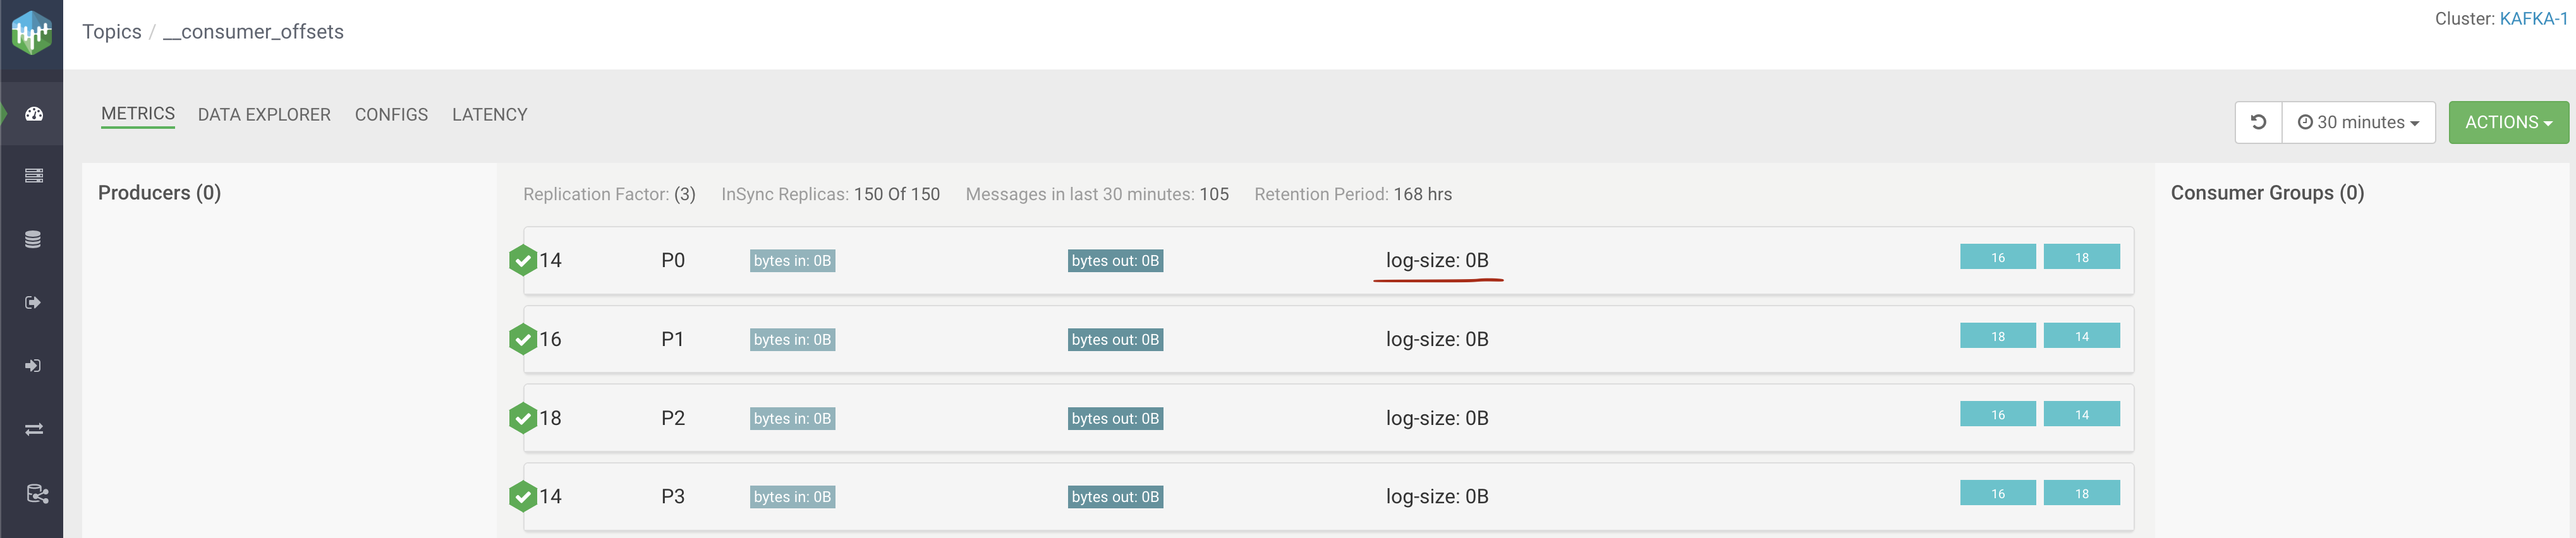
The Topics tab on the Overview page represents
topics and you can select one of them. In this case the topic’s leader partitions are
viewable and here you can find the leader partition log-size. If you click a partition,
a pop-up window appears, where log-size information is displayed.
If you click Profile for a topic, log-size of replica-leaders
appears, hosted by the broker.
Log size details for brokers
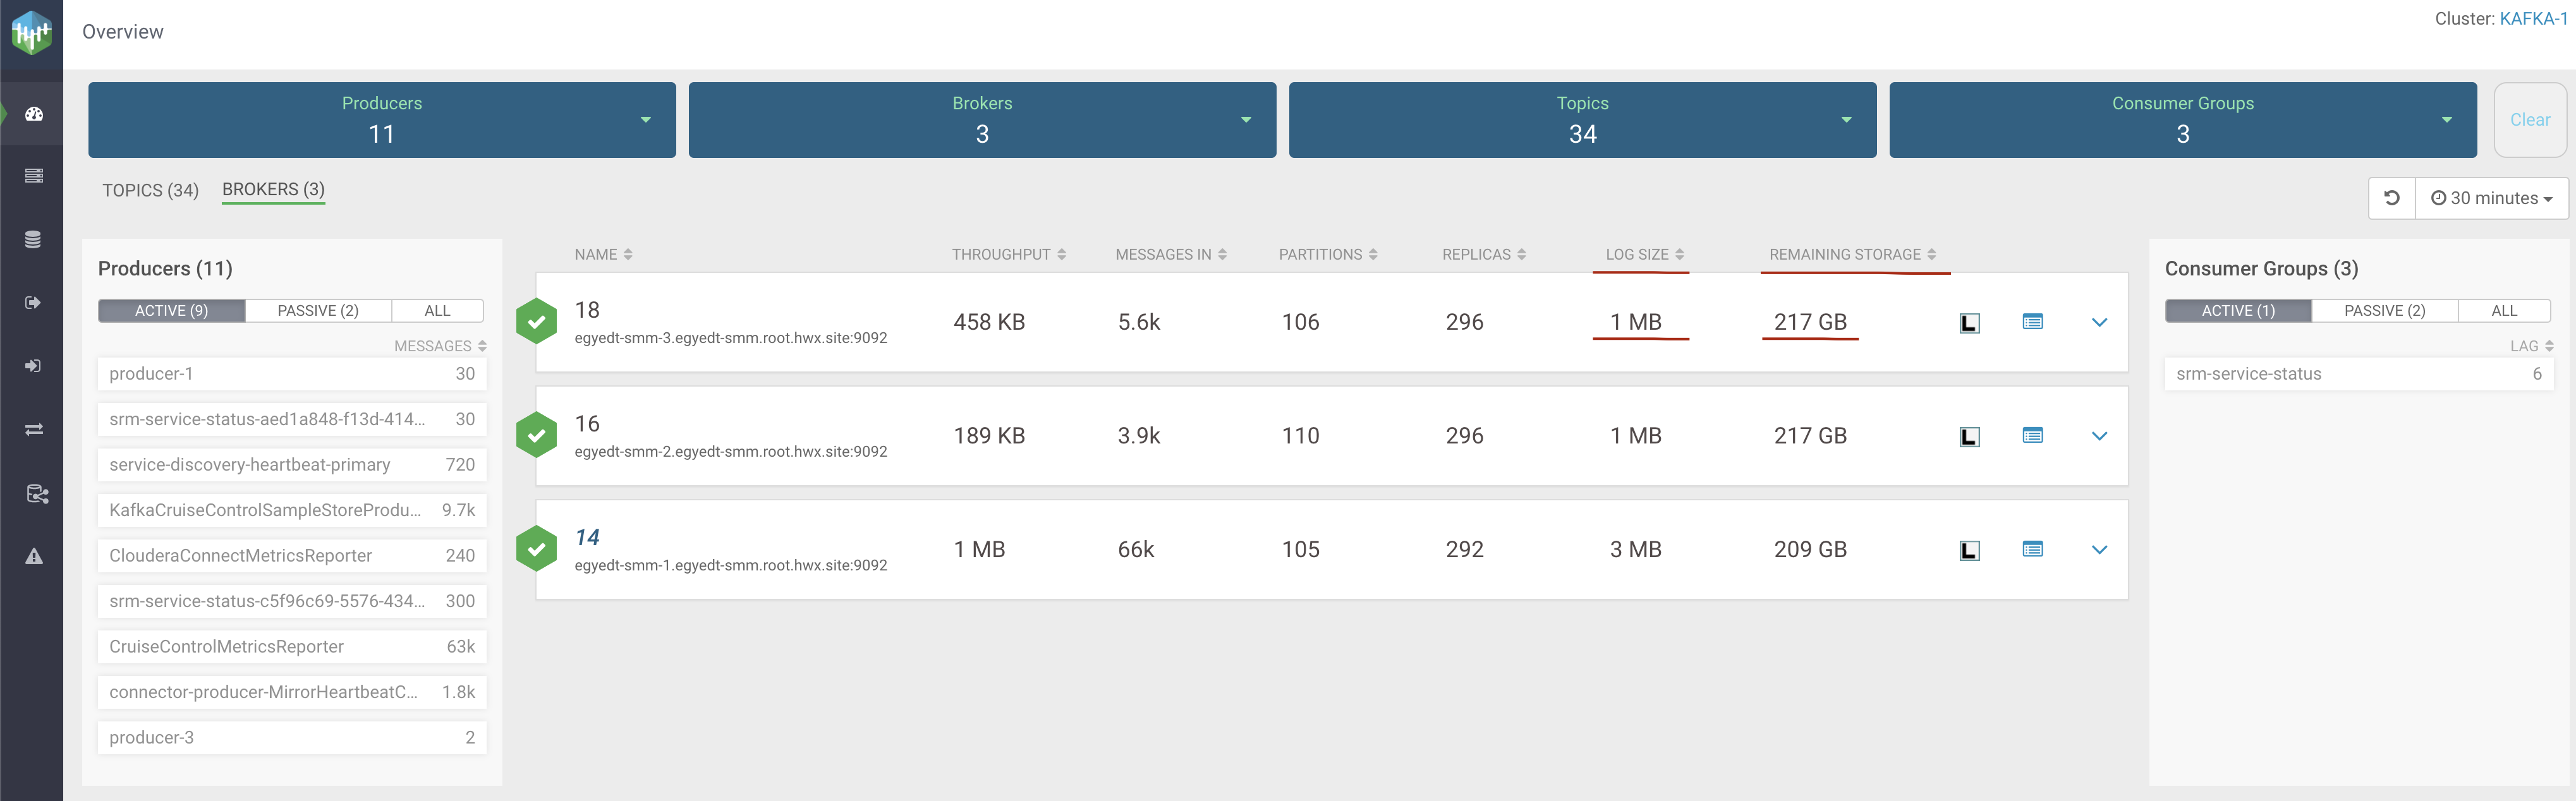
On the Overview page, the Brokers tab contains
two sortable columns called Log Size and Remaining
Storage. The log-size is calculated for all the partitions including the
follower partitions. The remaining storage column contains the available capacity in all of
the configured log directories. The broker related log-size improvements or information are
also available on the Brokers page.
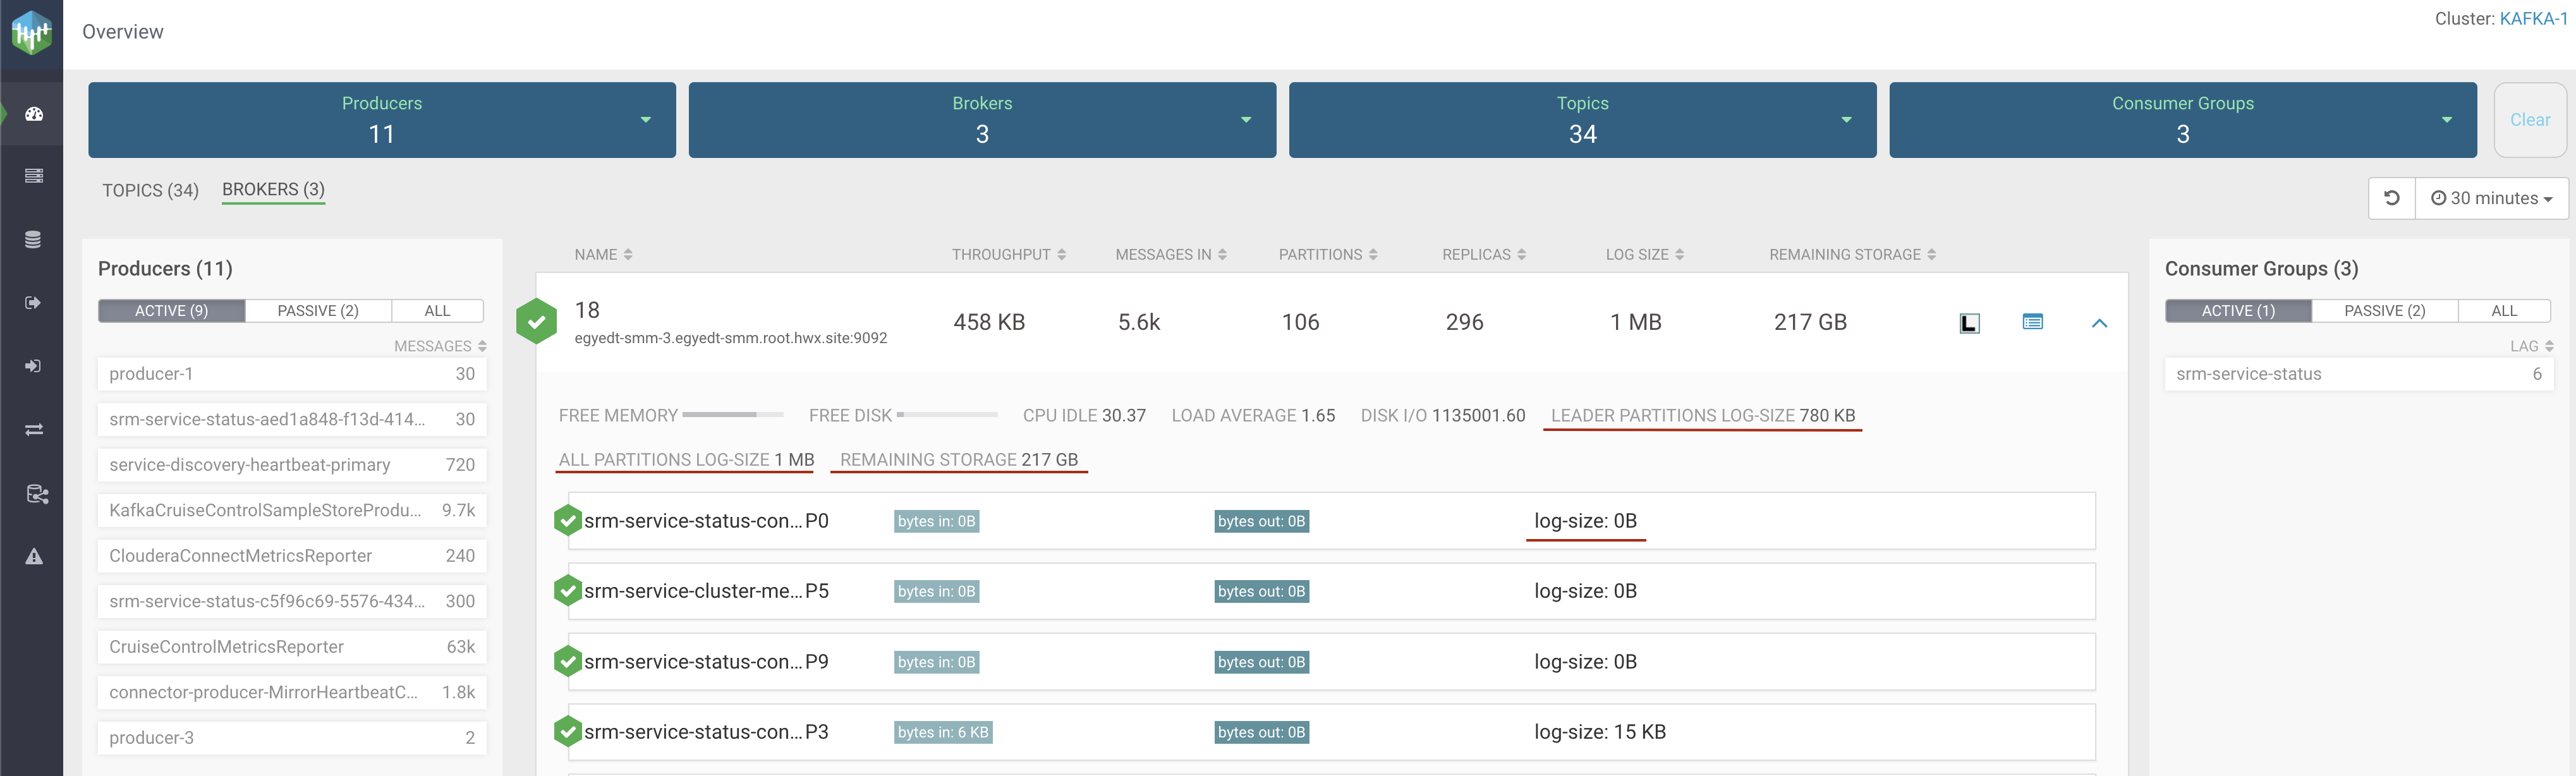
If you click the arrow icon for a broker, the details of that broker are displayed. The
Leader Partition Log-Size shows the sum of leader partitions’
log-size. The All Partitions Log-Size field’s value is equal to the
sortable column’s value called Log Size (naming is different to make
the sortable column names as short as possible). The Remaining
Storage sortable column and field is the same (value and name).
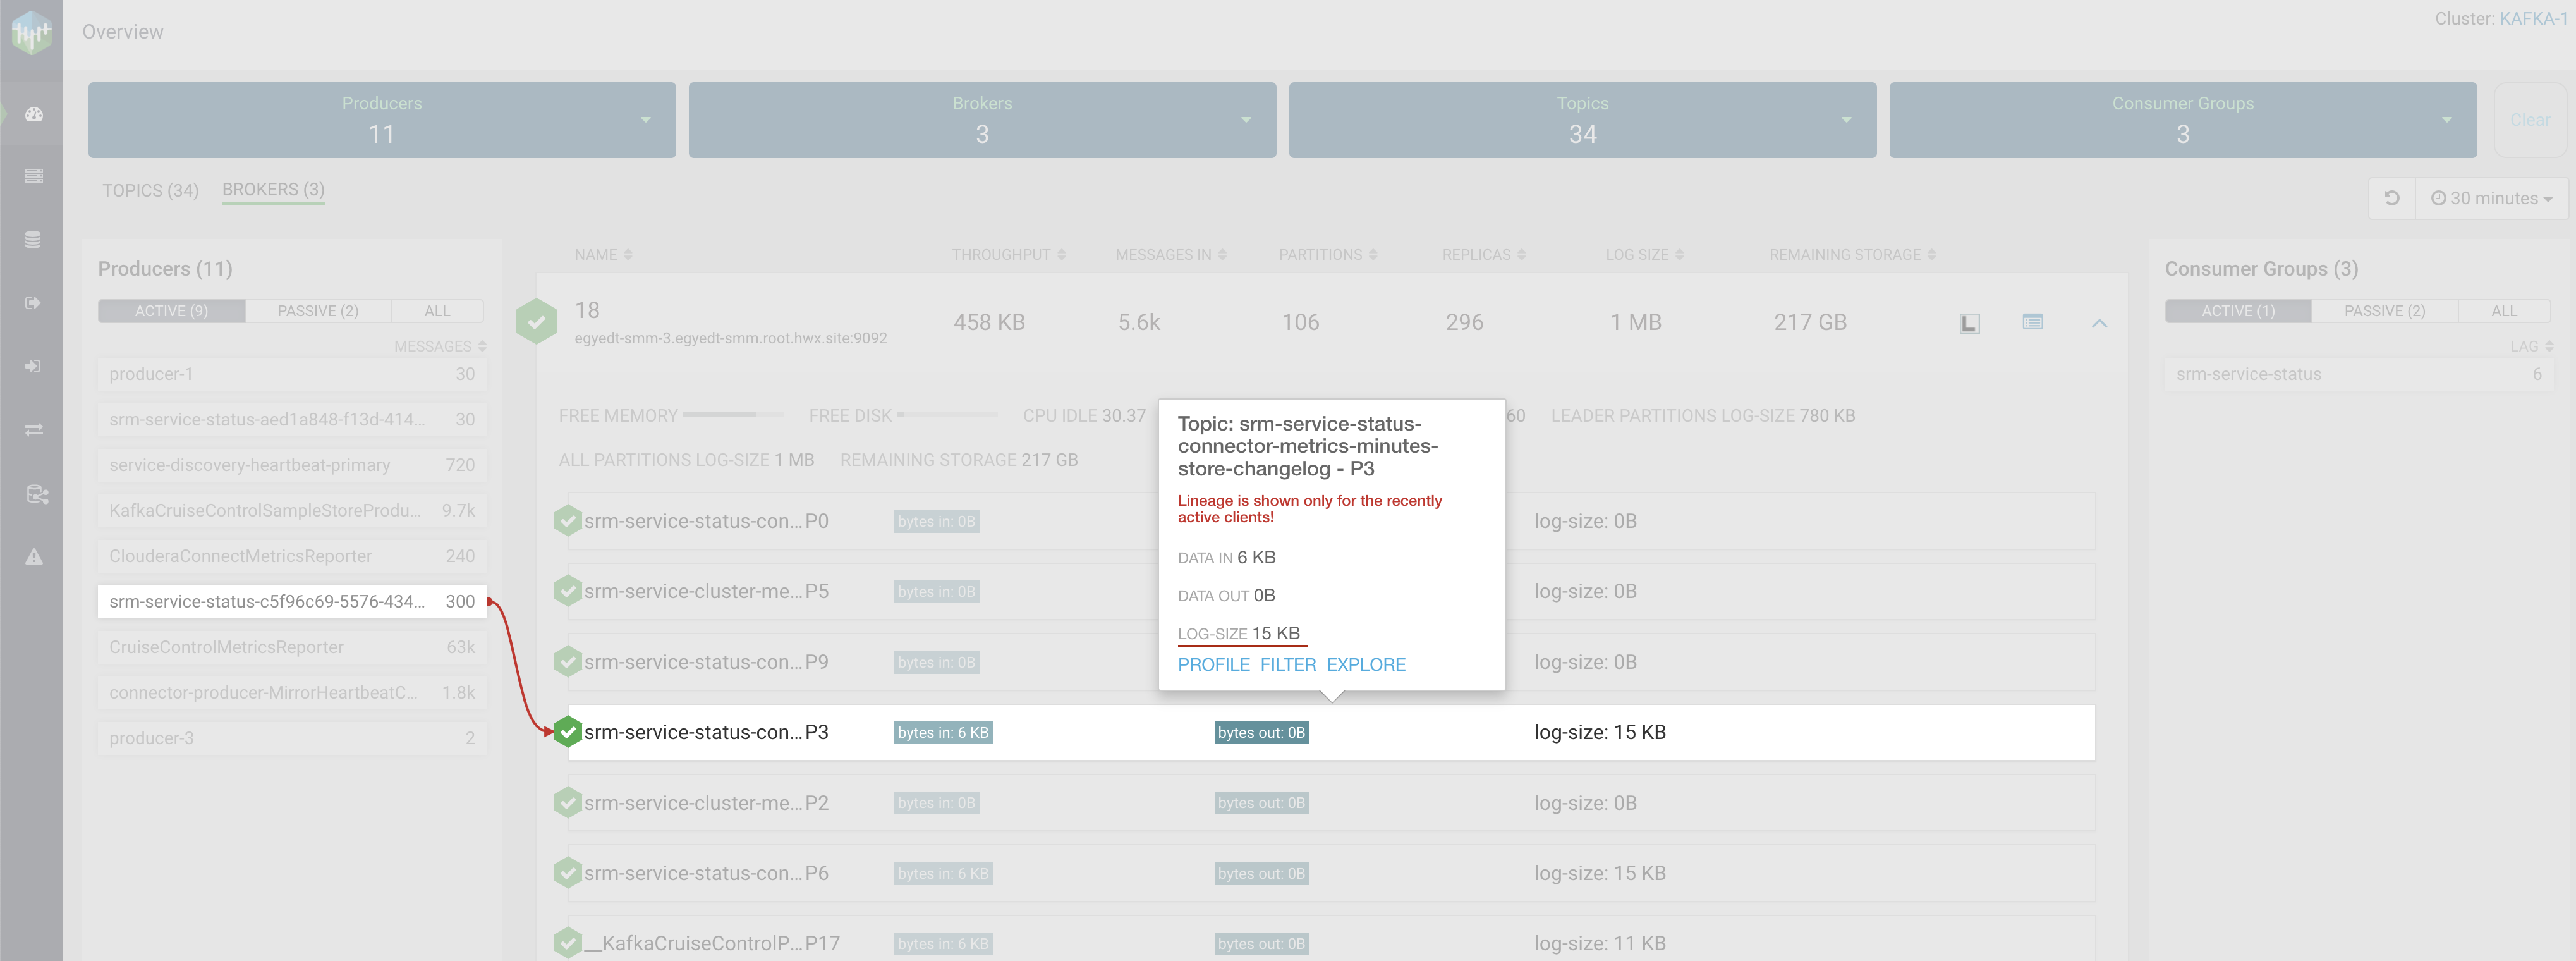
If you click a specific partition, a pop-up window appears where log-size information is
displayed.
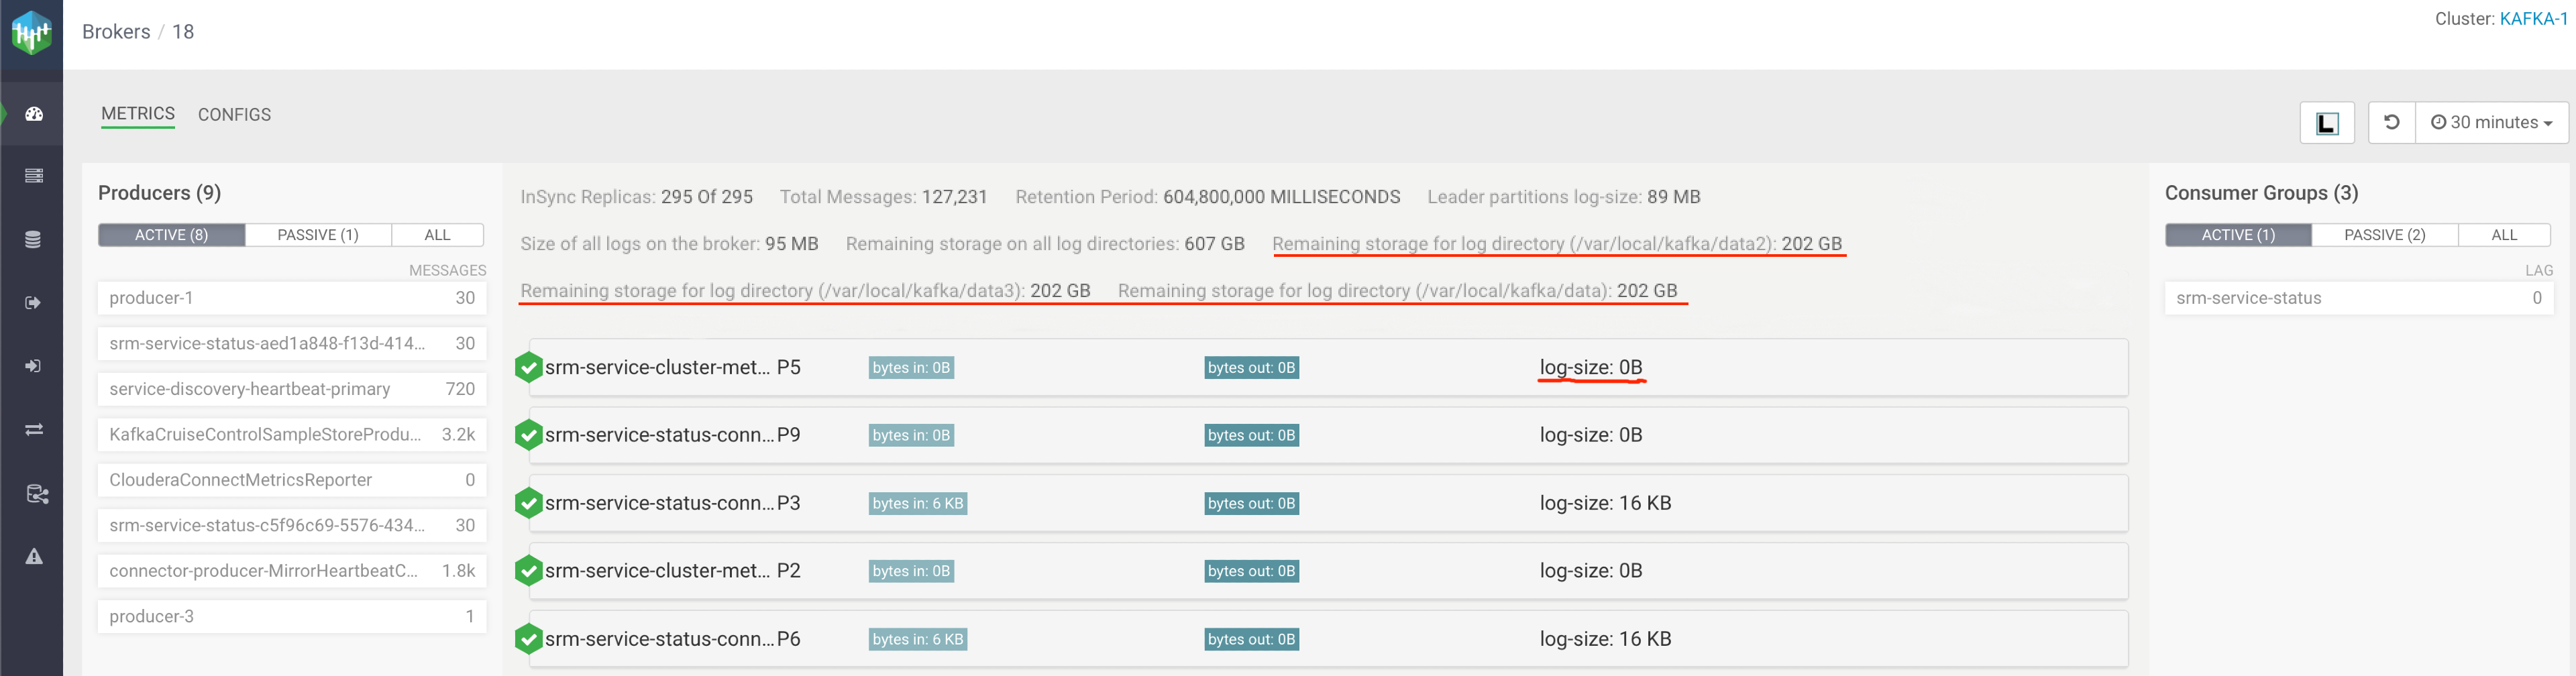
If you click Profile of a broker, then the metrics details for that
broker are displayed. The log-size information per partition is available. Furthermore, the
sum of leader partitions’ log-size, remaining storage size, and all partitions log-size
details are also available. The Metrics tab on the
Brokers page contains the available storage size per log
directory.
If there is any issue with the query on the log directory information, then a warning message
appears. There can be multiple warnings if more than one broker is related. But no new
warning message from a specific broker appears until the previous message disappears.
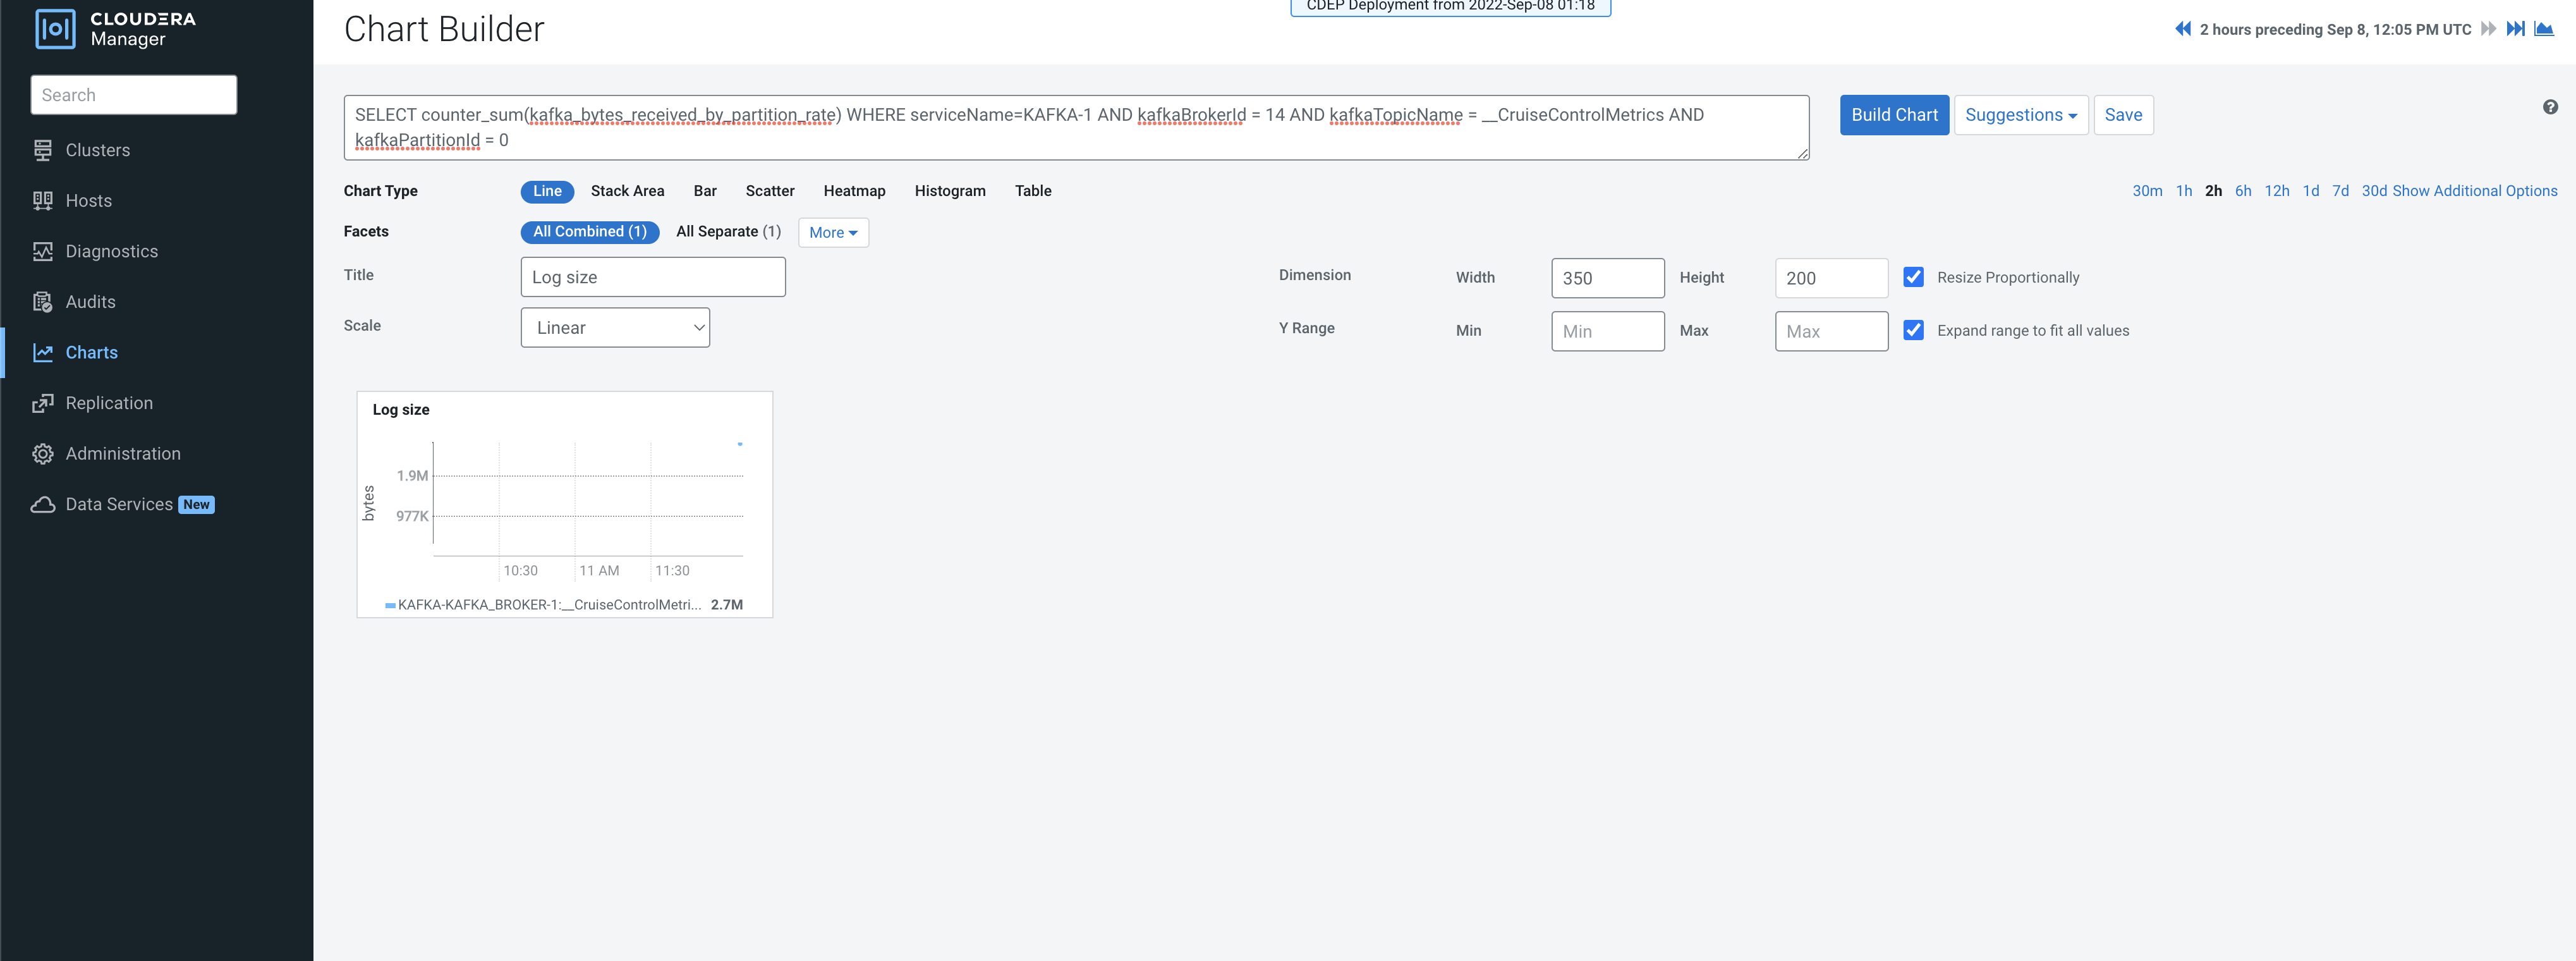
Cloudera Manager chart builder
For historical information, you can use the chart builder provided in Cloudera Manager. The
following command and screenshot show Kafka log-size data from the past where the broker ID
and topic name with the topic partition are
specified.
SELECT counter_sum(kafka_bytes_received_by_partition_rate) WHERE serviceName=KafkaServiceName AND kafkaBrokerId = KafkaBrokerId AND kafkaTopicName = KafkaTopicName AND kafkaPartitionId = kafkapartitionId