By monitoring Kafka topics, you can track the total number of topics in your cluster and
details about the topics. You can also monitor Grafana metrics for the topics in your
cluster.
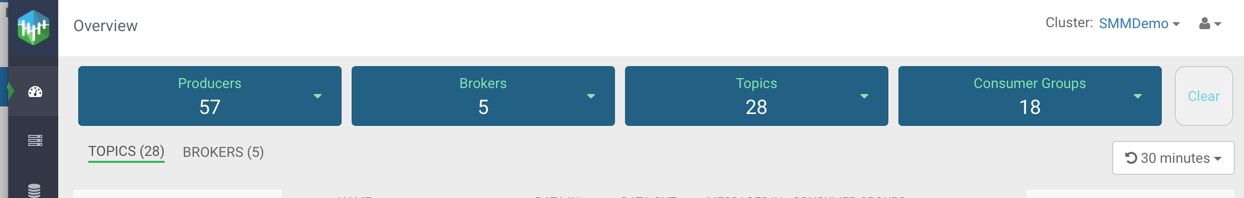
Viewing the total number of topics in your cluster
You can see the total number of topics in your Kafka cluster on the
Overview page.
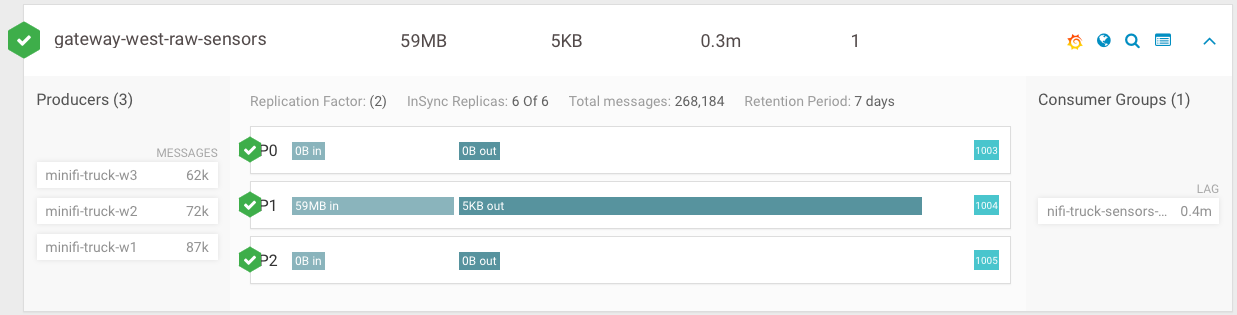
Detailed information about topics
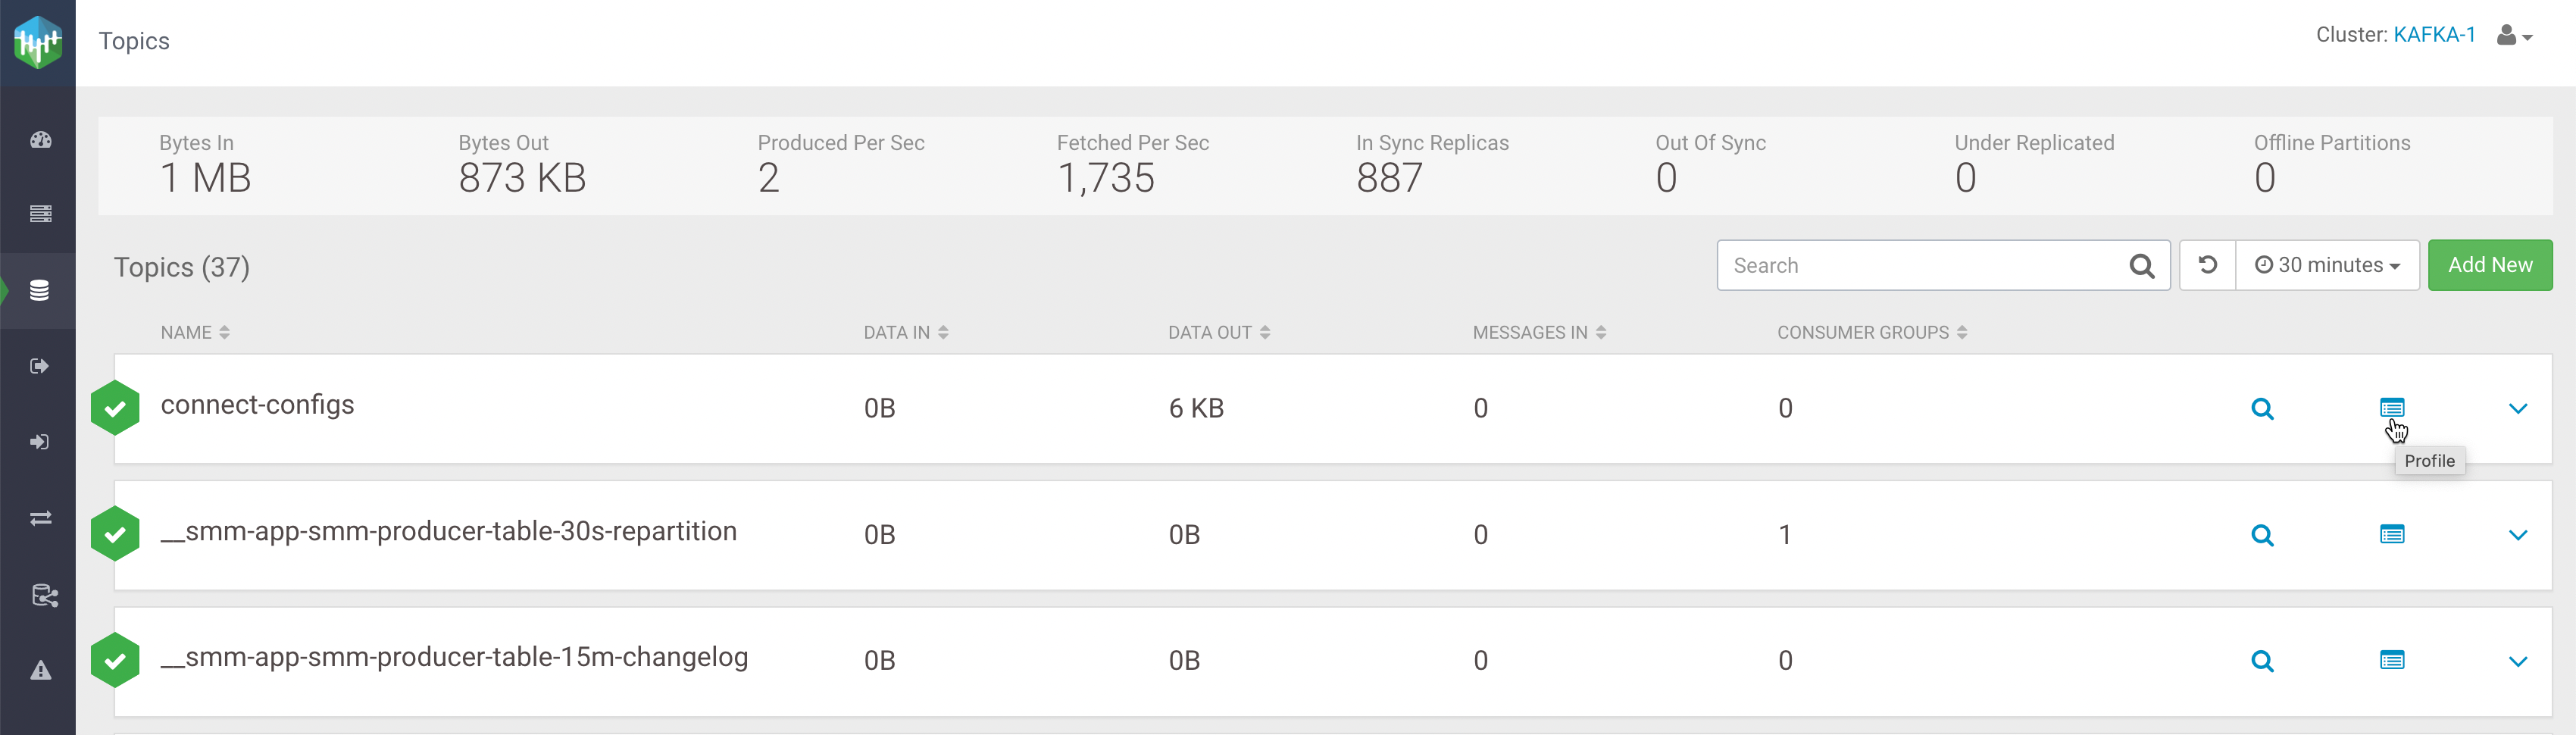
The Topics page contains a number of useful details about your Kafka
topics. This page helps you answer the following questions:
How can I see if the replicas in this topic are in sync?
How do I see this topic's retention rate?
How can I see the replication factor for this topic?
How do I see the producers and consumers that are connected to this topic?
How do I find the total number of messages going into this topic, over a specified time
range?
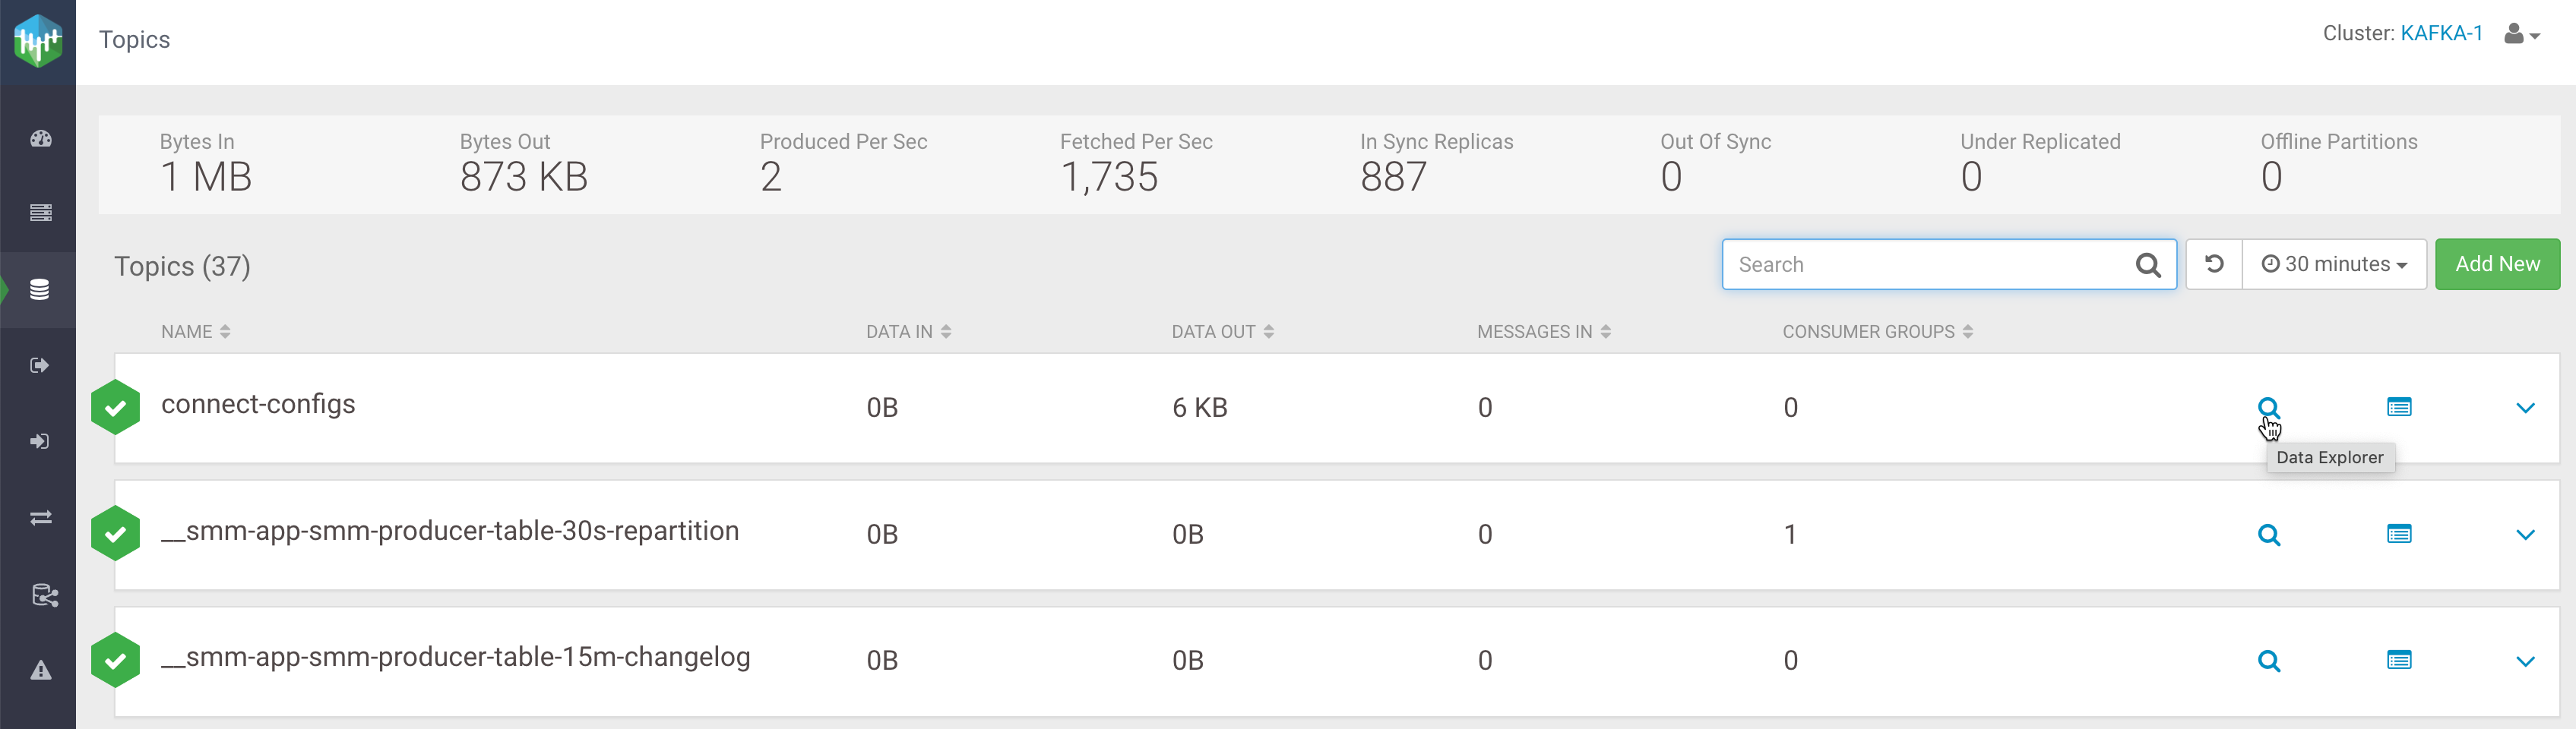
To access this detailed topic information:
From the left navigation pane, click Topics.
Identify the topic about which you want information. You can either scroll through the list
of topics, or use the Search bar at the top left of the page.
Click the green hexagon at the left of the topic to view details.
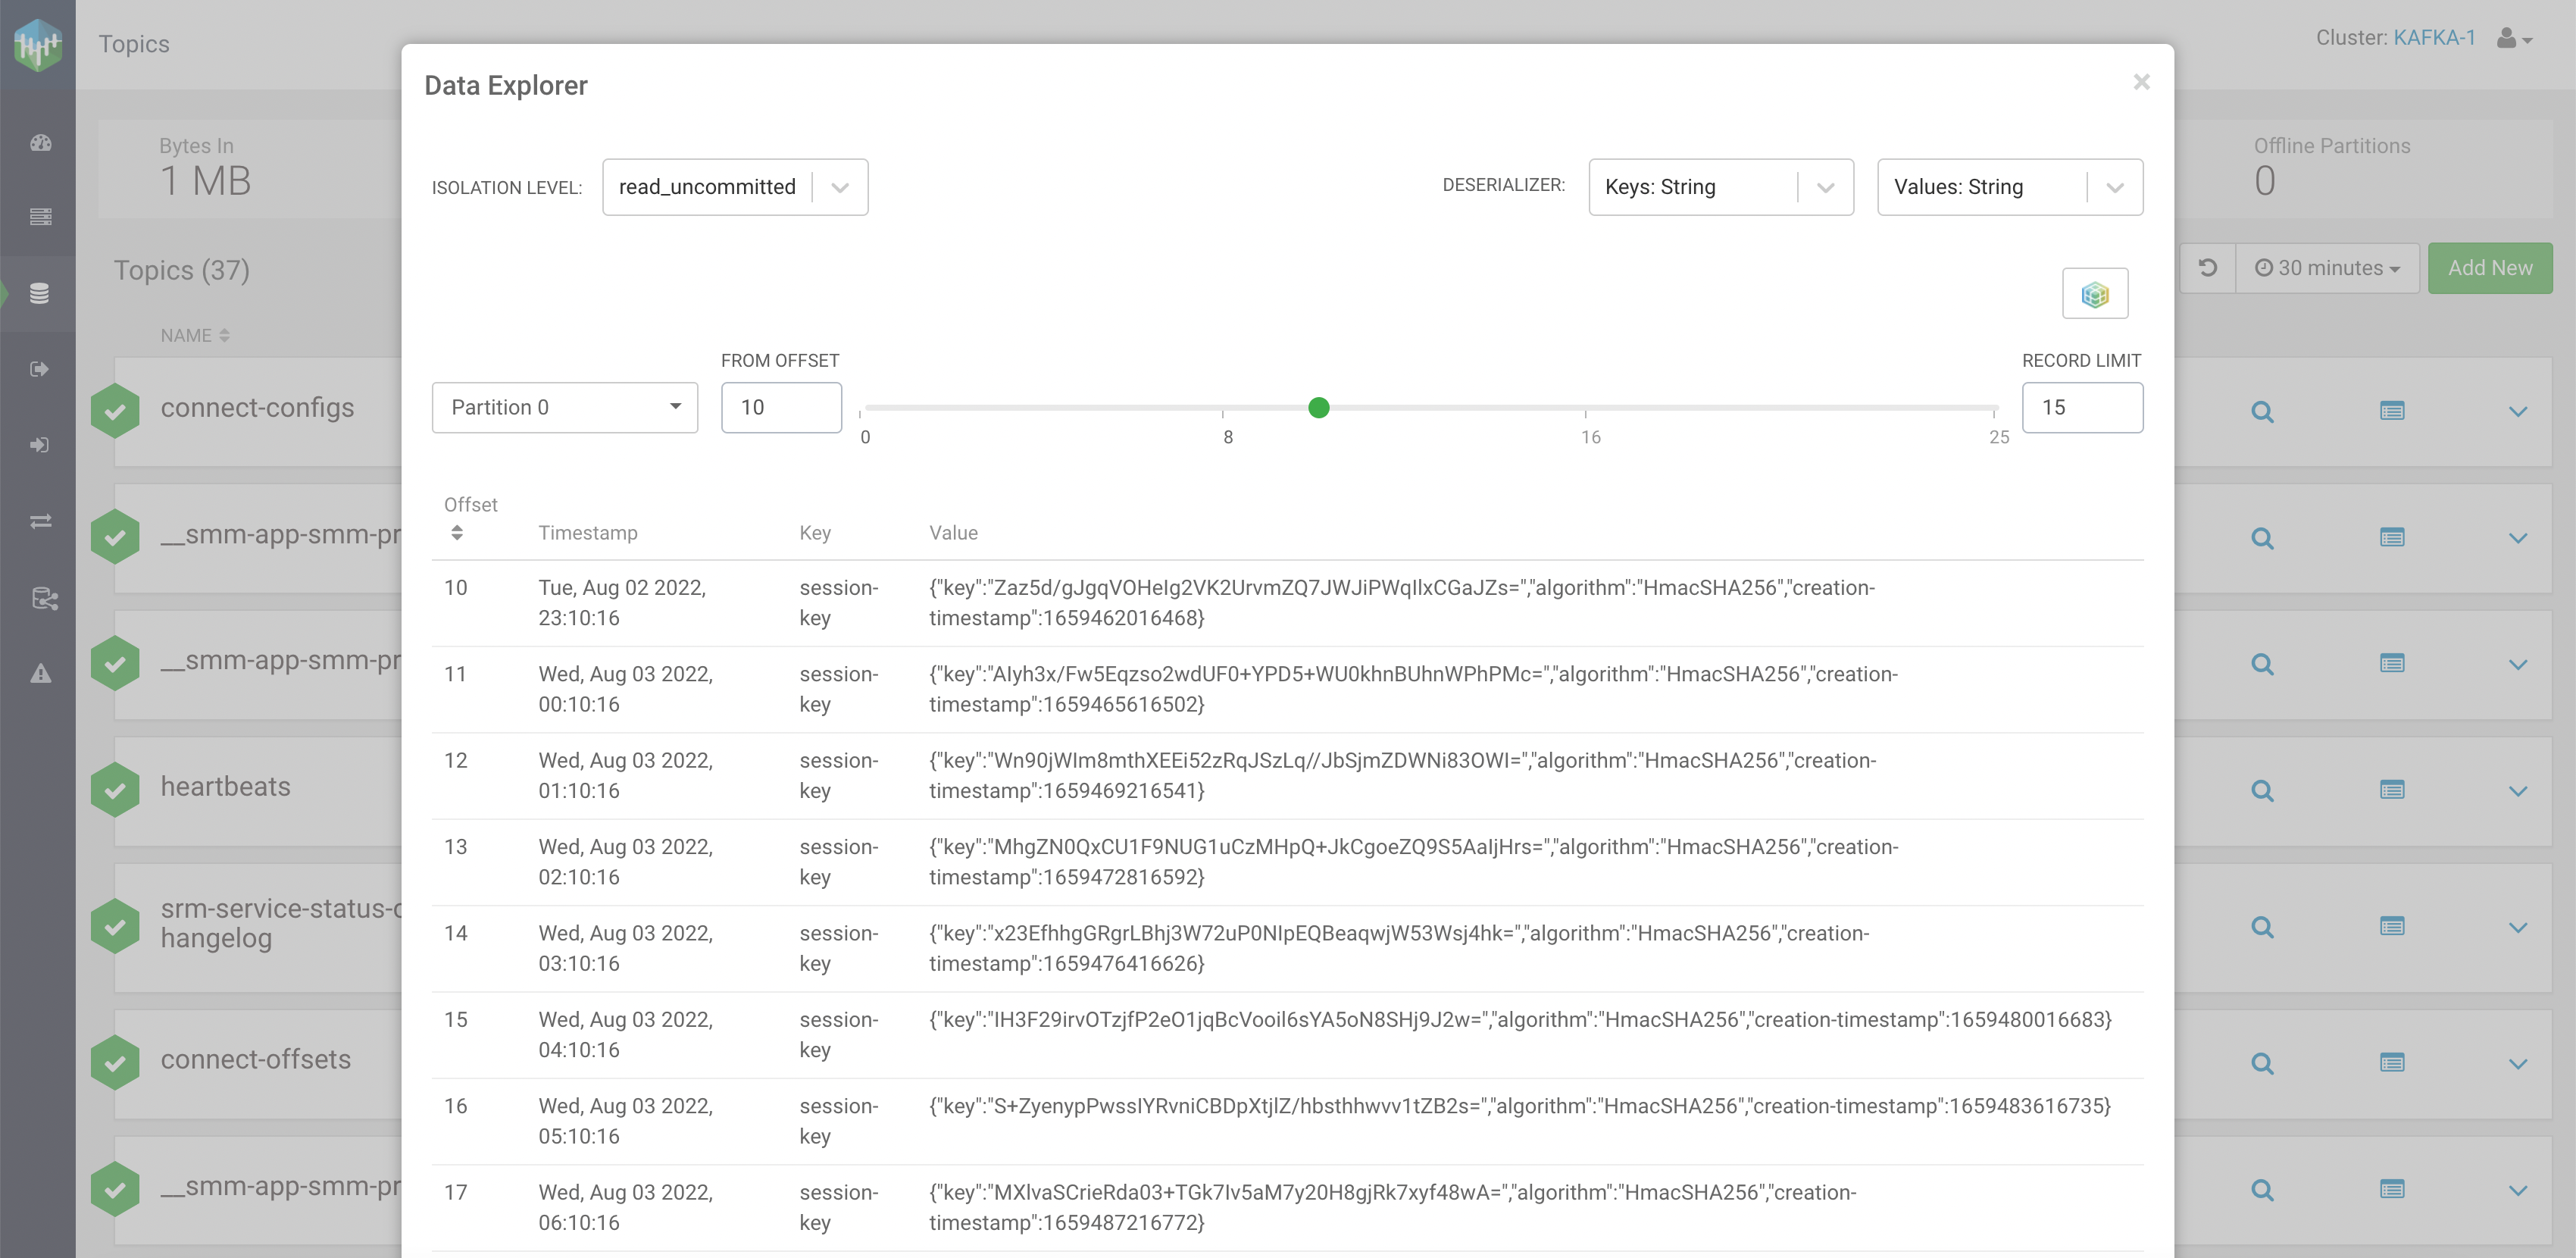
Viewing topic messages using Data Explorer
Data Explorer is a simple Kafka consumer within SMM. It enables you to view the content of a
Kafka topic. You can select any Kafka topic and any partition within that topic, and view
messages from the selected partition.
You can reach Data Explorer in two ways. One way is from the Topics
page, and the other is from the Overview page. In both pages, you need
to either click the magnifier icon, or navigate to the Topic Details
page and then select the Data Explorer tab. The following steps
describe the process:
Log in to the SMM UI.
From the left navigation pane, click Topics.
Identify the topic for which you want the message information. You can either scroll
through the list of topics, or use the Search bar to find a
topic.
Click the Data Explorer icon for that topic.
The Data Explorer dialog appears.
Alternatively, you can click the Profile icon for
that topic. Then go to the Data Explorer tab.
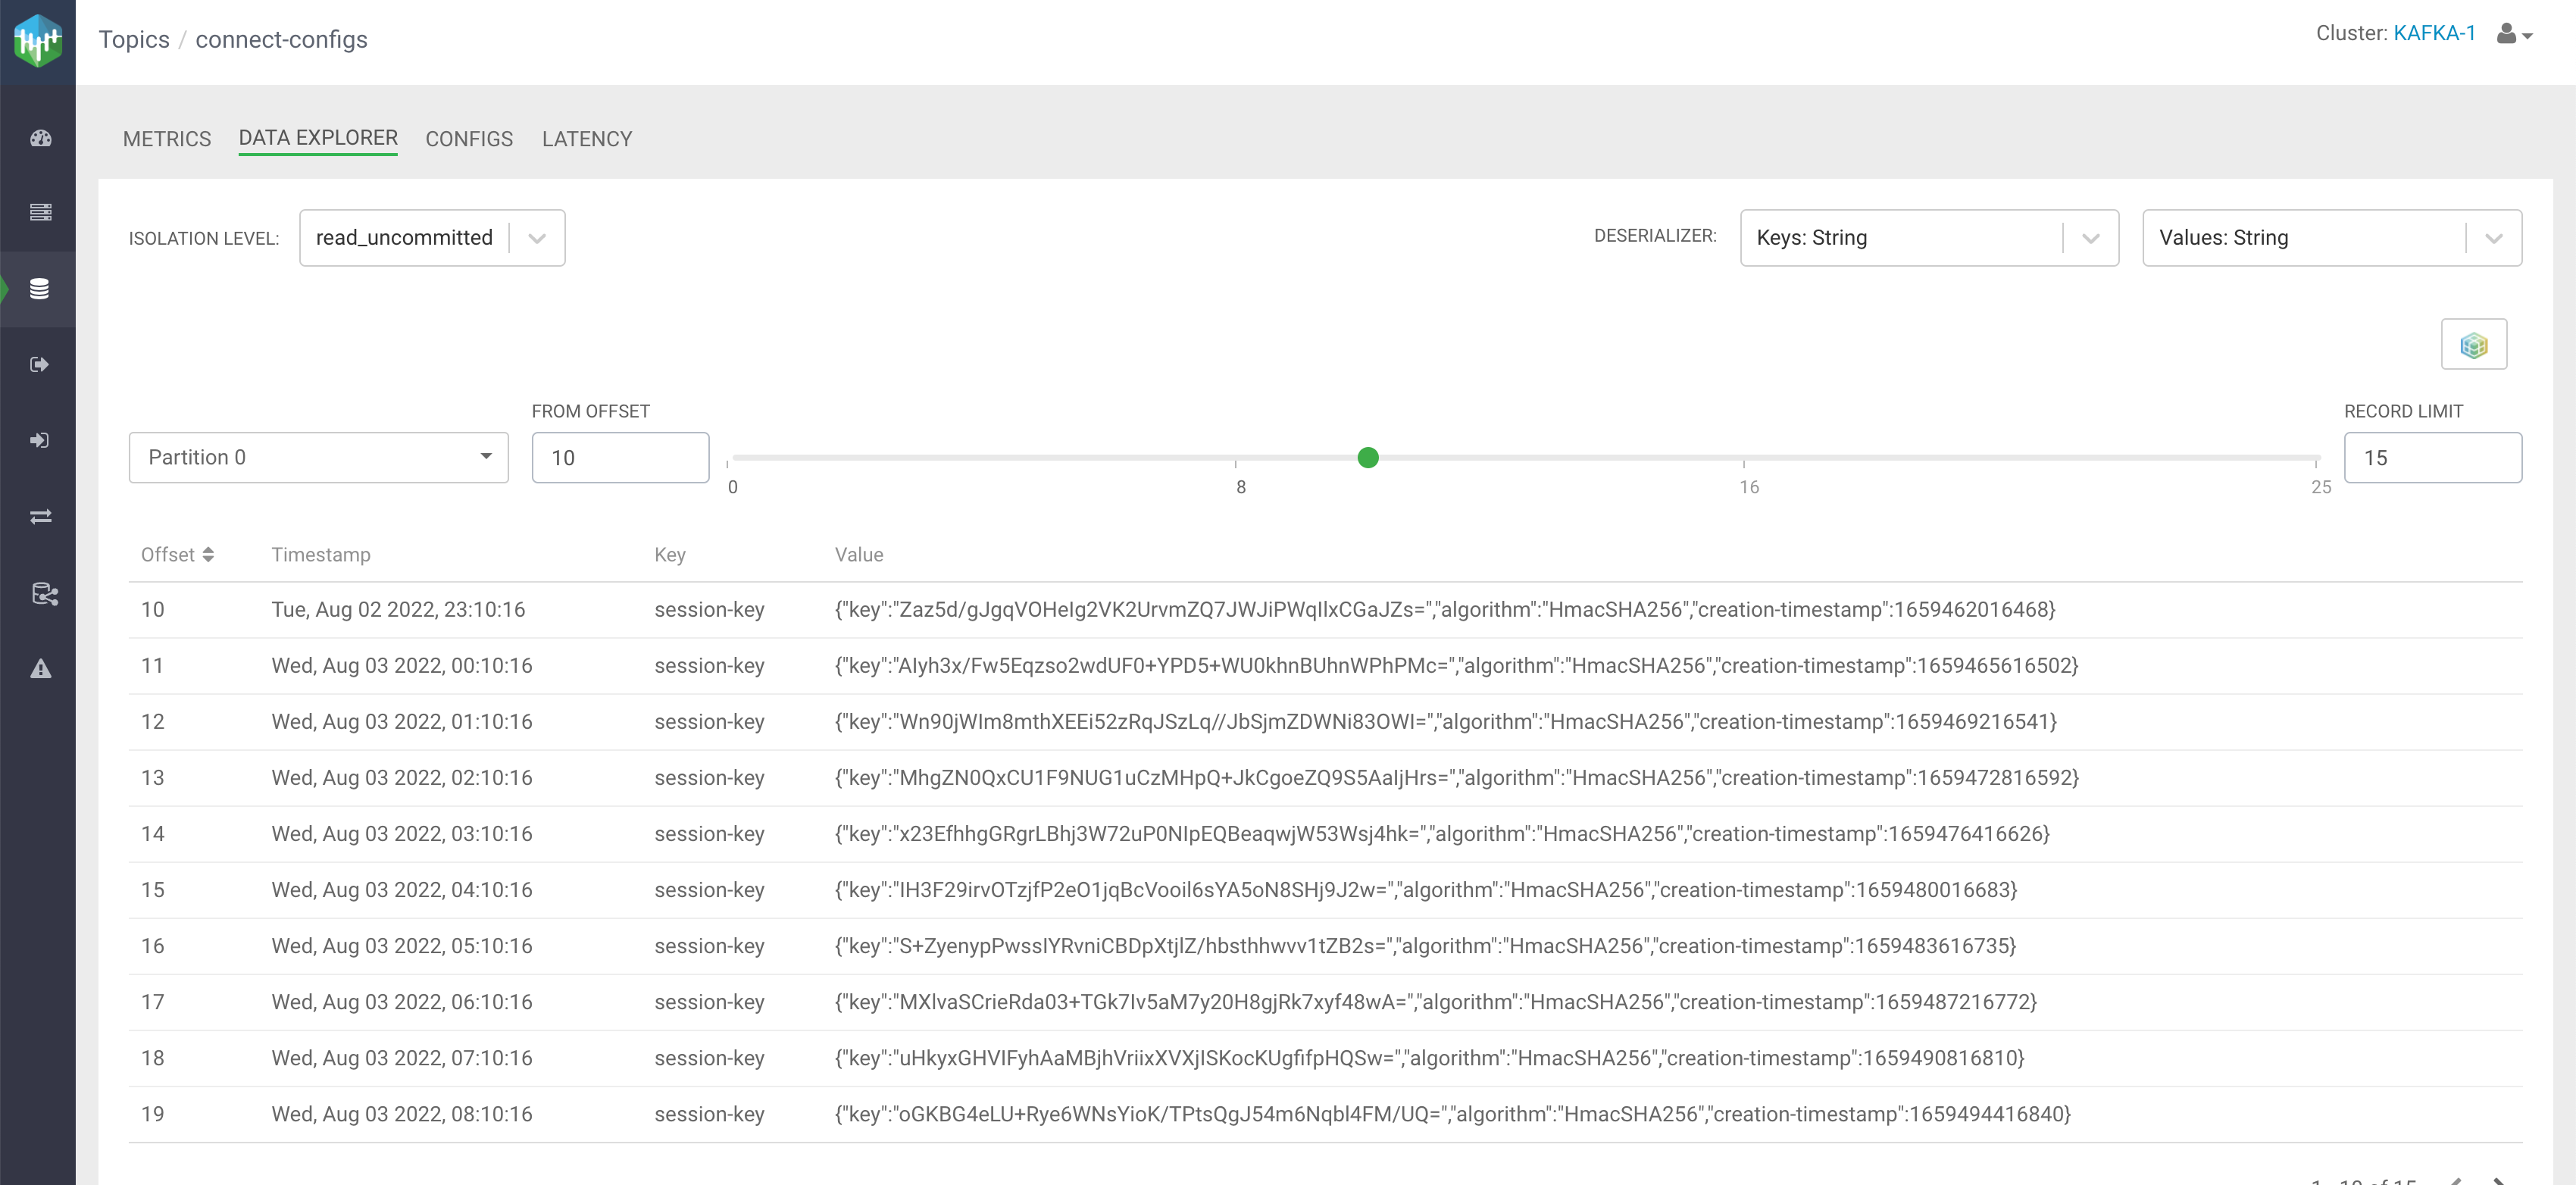
Select any of the following modes in the Isolation Level
option:
read_committed
read_uncommitted
The isolation level specifies whether uncommitted transactional messages should
be read. By default, it is set to read_uncommitted.
Select the deserializer types for the Keys and
Values options.
For example, if you select Avro, SMM uses the
schema that can be found in Schema Registry to deserialize the messages.
Select a Partition.
The Kafka topic must have partitions to
select from.
Select a value for the From Offset field.
You can also use
the selection bar to select an offset value. The maximum value is the offset of the
last message.
Select a Record Limit.
The record limit value is the number
of messages that are fetched starting from the message offset number selected in the
From Offset field.
To see long messages, click show more beside a message.
The
message opens in a dialog or a new tab based on the size of the message.
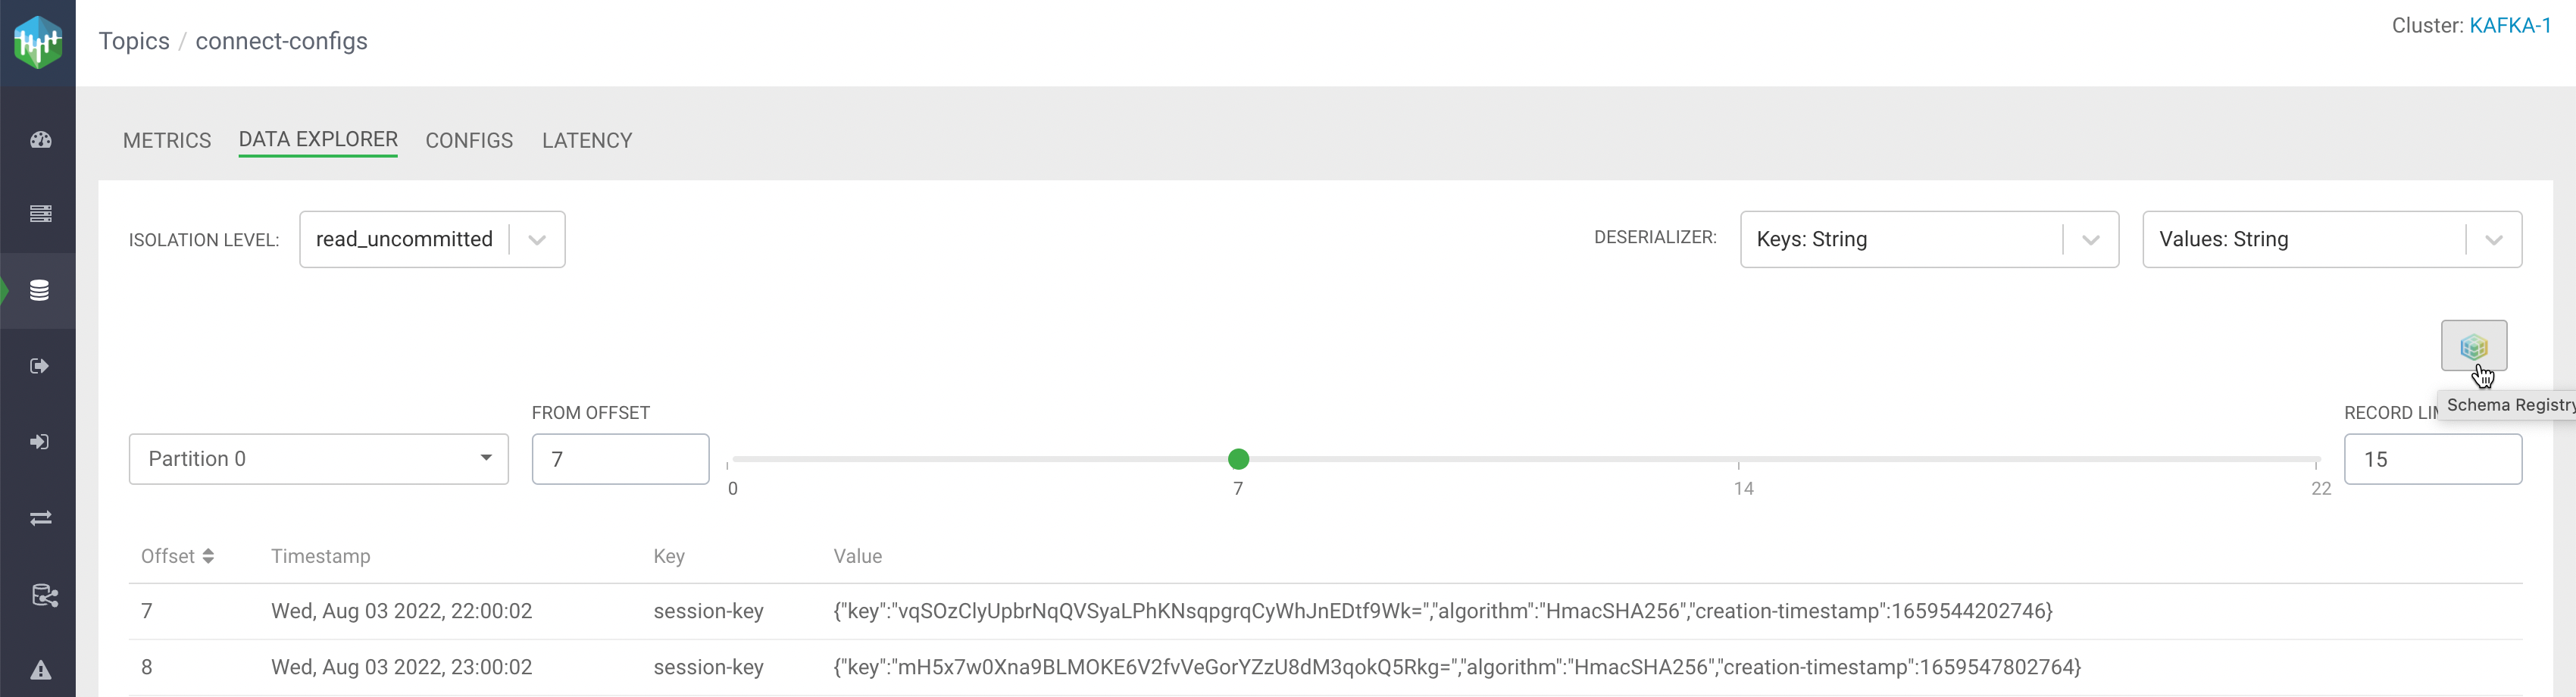
Click the Schema Registry icon to go to
the related page in the Schema Registry UI.
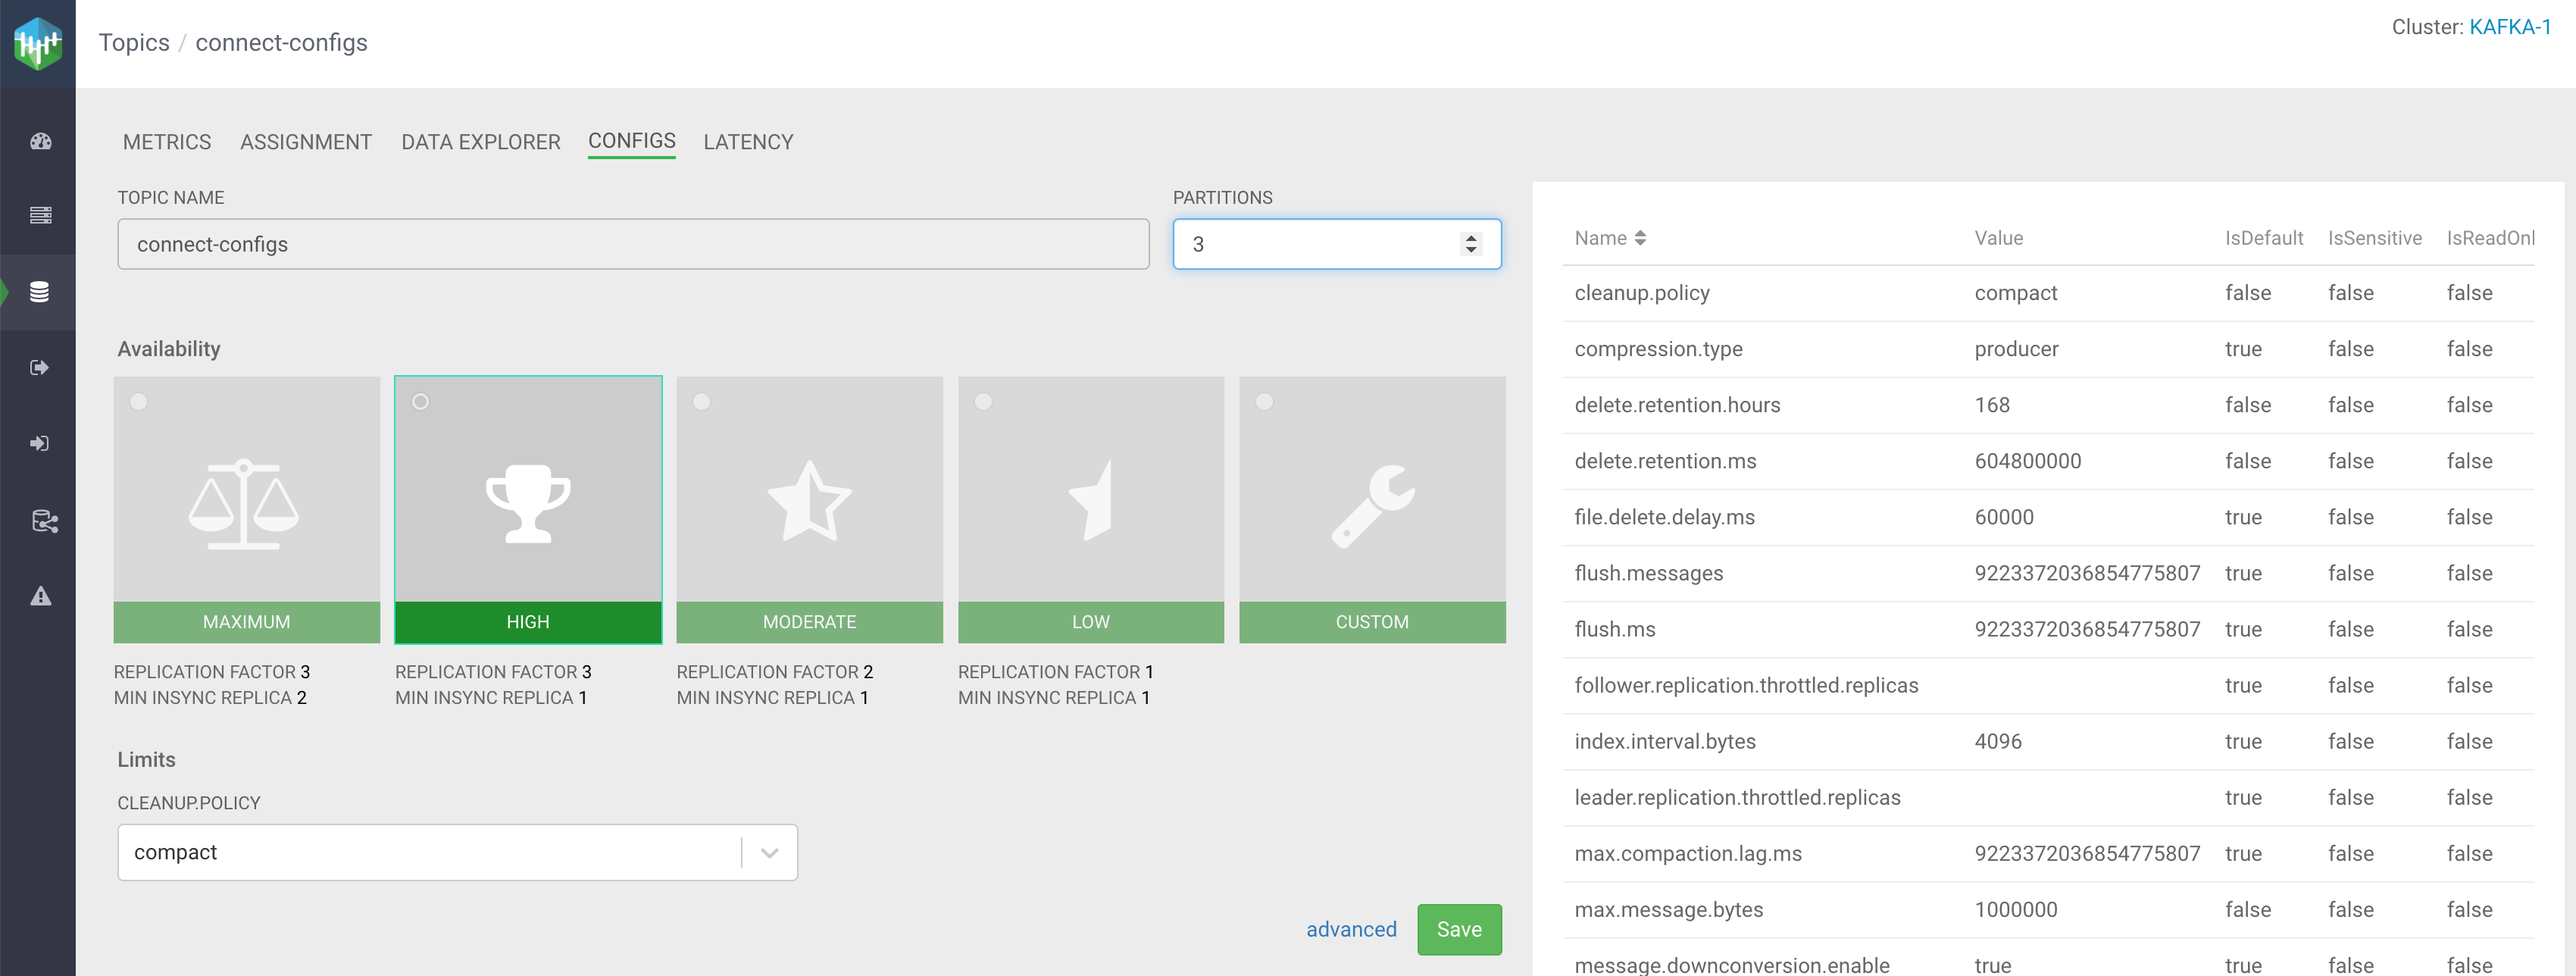
Increasing topic partition
You can increase the number of partitions of a topic
The following steps describe the process:
Log in to the SMM UI.
From the left navigation pane, click Topics.
Identify the topic for which you want to increase the topic partition number. You can
either scroll through the list of topics, or use the Search bar
to find a topic.
Click the Profile icon for that topic.
Go to the Configs tab.
Enter the partition number in Partitions or increase it using
the arrows.
Click Save.
A dialog appears to ensure the
increment.
Click Yes.
Refresh the page to see the change.
Getting current state of the topic partitions (Tech Preview)
The experimental Assignment tab, on the topic details page, shows
the current state of the topic. It shows some topic-level statistics and the replica
assignment of all partitions. If rack awareness is used in the Kafka cluster, the replica
assignment is shown in a rack-based view. If the rack IDs follow the format of multi-level
rack IDs, the rack IDs are rendered as a hierarchy. For more information on rack awareness,
see Kafka rack awareness.
To go to the Assignment tab, click the
Profile icon for a topic from the Overview
or Topics page, and then click the Assignment
tab. You can view the following statistics there:
Number of offline partitions
Shows the number of offline partitions in the topic. A
partition is offline if it does not have a leader. Partitions can become offline if
all their in-sync replicas are offline.
Number of under-min-ISR partitions
Shows the number of under-min-ISR partitions in
the topic. A partition is in an under-min-ISR state if the number of in-sync replicas
is lower than the value set in the min.insync.replicas property of
the topic. The minimum in-sync replicas configuration defines how many replicas must
acknowledge a produced message before the produce request is considered
successful.
Number of under-replicated partitions
Shows the number of under-replicated
partitions in the topic. A partition is under-replicated if it has at least one
out-of-sync replica.
Number of unevenly distributed partitions
This appears if rack awareness is being
used.
Shows the
number of unevenly distributed partitions in the topic. A partition is unevenly
distributed if the difference between the maximum and minimum number of replicas in a
rack is greater than one. This typically suggests that the partition does not meet
expected durability guarantees or that it causes uneven load on the cluster. If a
partition is unevenly distributed, try reassigning them. In most cases, unevenly
distributed partitions become evenly distributed across the racks after
reassignment.
Number of unused racks
This appears if rack awareness is being used.
Shows the
number of racks which are currently not used by this topic. A rack is unused if the
topic has no replicas residing in that rack. This typically suggests that the
partition does not meet expected durability guarantees because it is not using all
available racks (physical locations) to store replicas of the data. This is expected
and does not cause issues for non-critical topics that have an intentionally low
replication factor.
In the replica assignment table, replicas are shown with different colors:
Leader replicas are green
In-sync replicas are blue
Out-of-sync replicas are red
In addition, offline partitions and out-of-sync partitions are red. Under-replicated
partitions, unevenly distributed racks, and unused racks are orange. When a specific
partition or rack has one of these issues, a warning sign appears next to it.
Leader and in-sync replicas also act as links to the corresponding broker details page.
In the table header and in the first column, warning icons are shown if the specific column
or row is affected by one of the issues listed in the topic statistics.
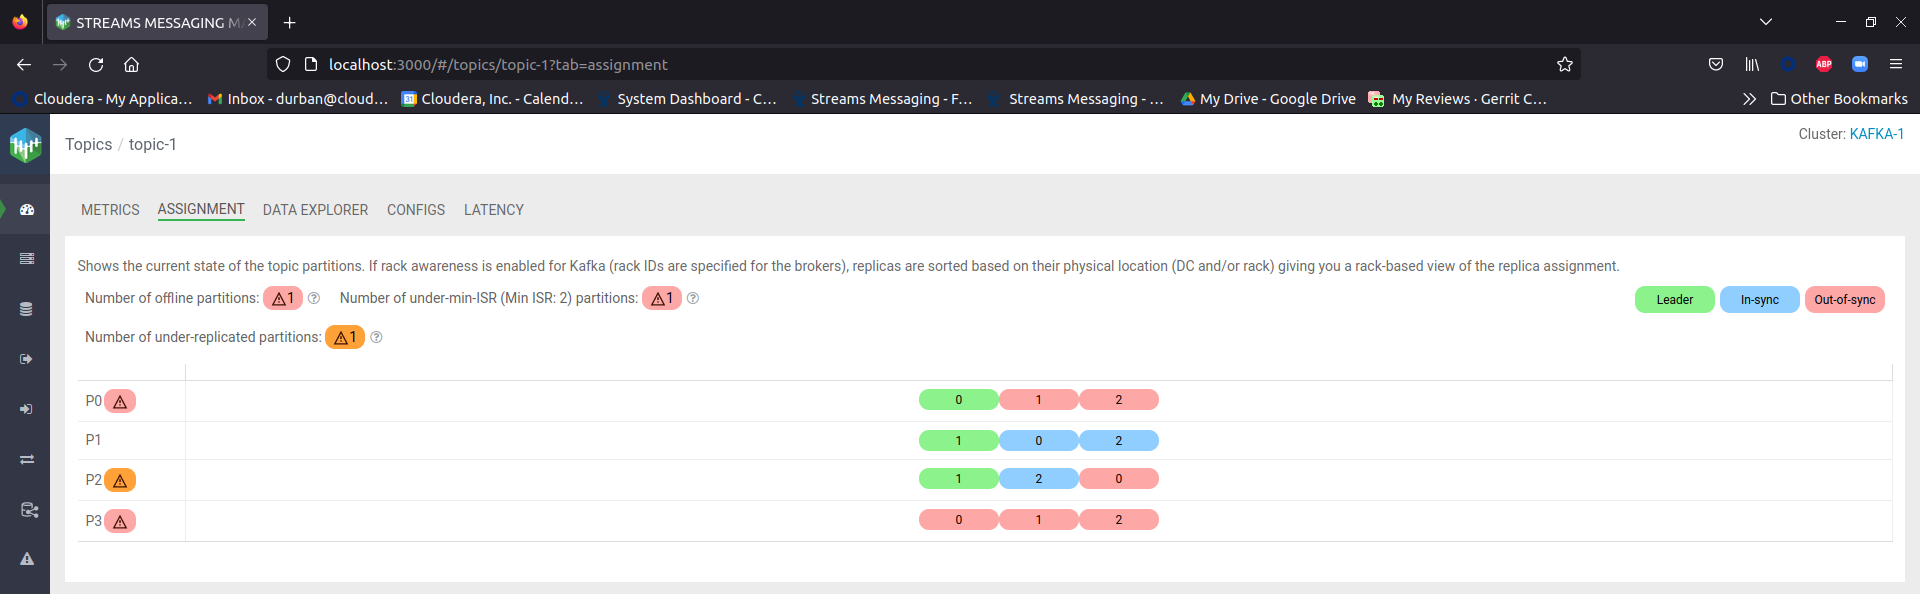
The following image shows the Assignment tab without racks:
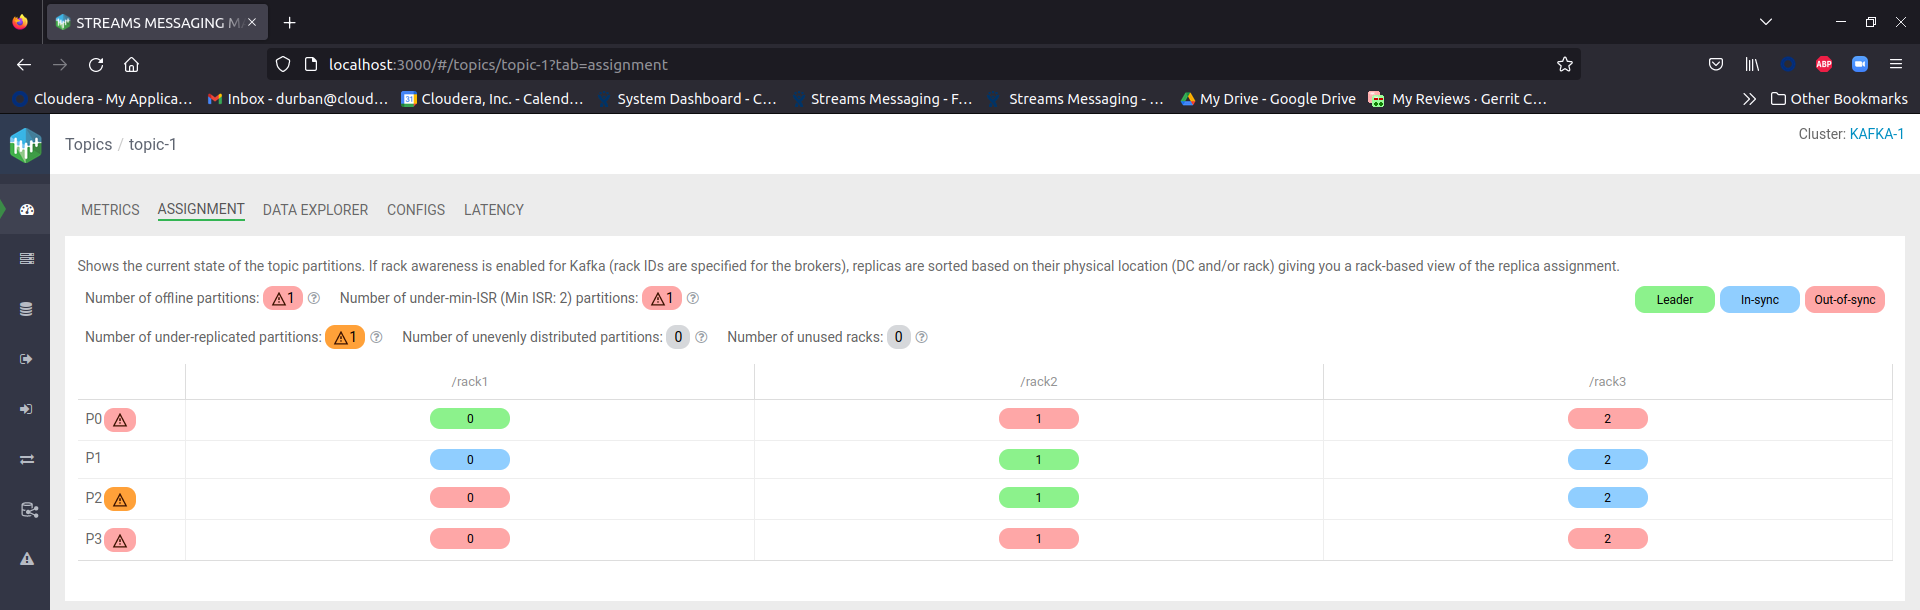
The following image shows the Assignment tab with racks:
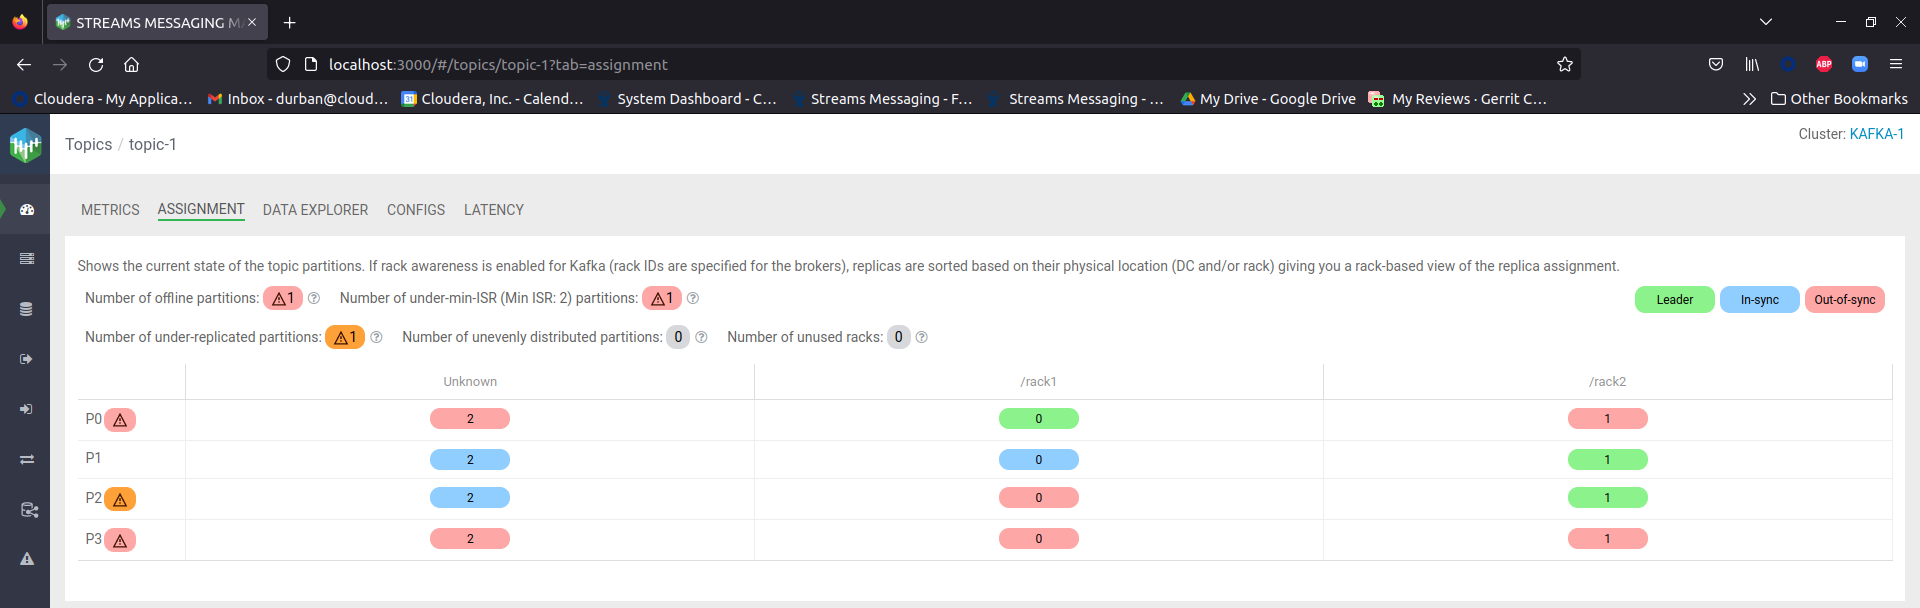
The following image shows the Assignment tab with racks, but with
one broker metadata unknown, which adds an extra Unknown column to
the table: