Troubleshooting an Abnormal Job Duration
Identify areas of risk from jobs running on your cluster that complete within an unusual time period.
Steps with examples are included that explain how to further investigate and troubleshoot the cause of an abnormal job duration.
-
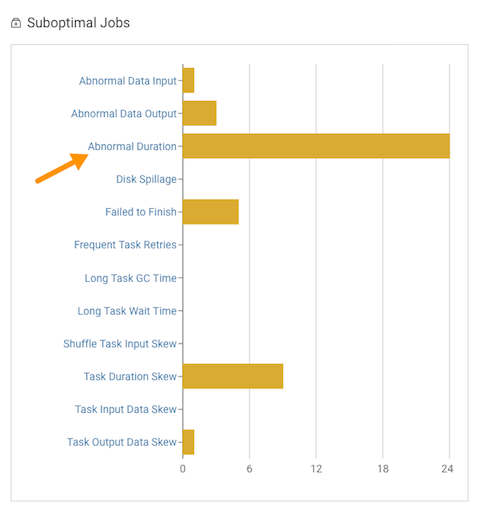
Display the number of jobs with an abnormal duration that executed within the
selected time period by clicking the Abnormal Duration
health check bar in the Suboptimal Jobs chart
widget.
The Job page opens, listing all the jobs that have triggered the Abnormal Duration Health check.
-
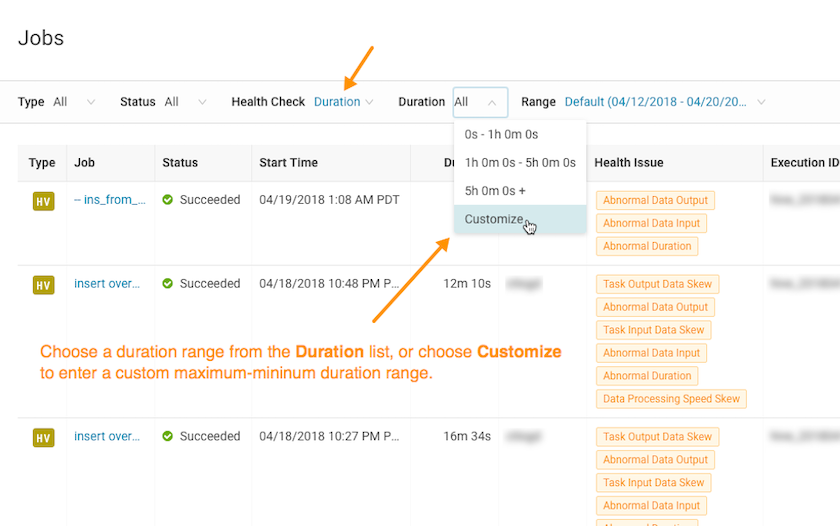
To specify a specific amount of time in which the job either ran less than or
more than the Health check rule, from the Duration list,
either select a predefined time duration or select
Customize and enter the minimum or maximum time
period.
-
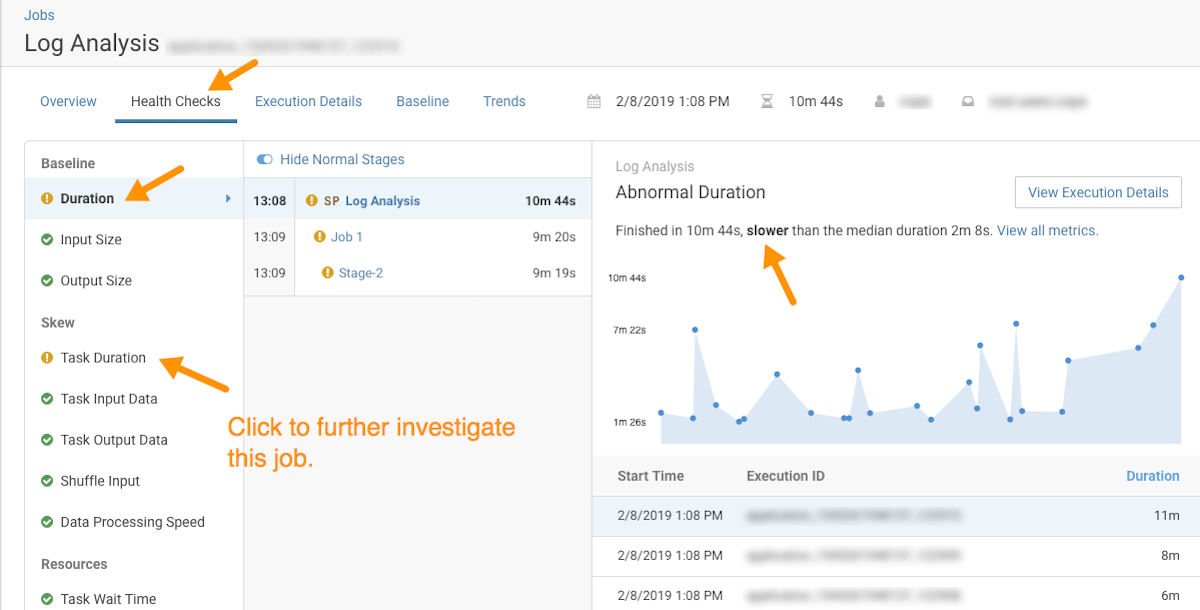
To display more information about the job's duration, from the
Baseline column, select
Duration.
For example, as shown in the following image the job finished much slower than the baseline:
-
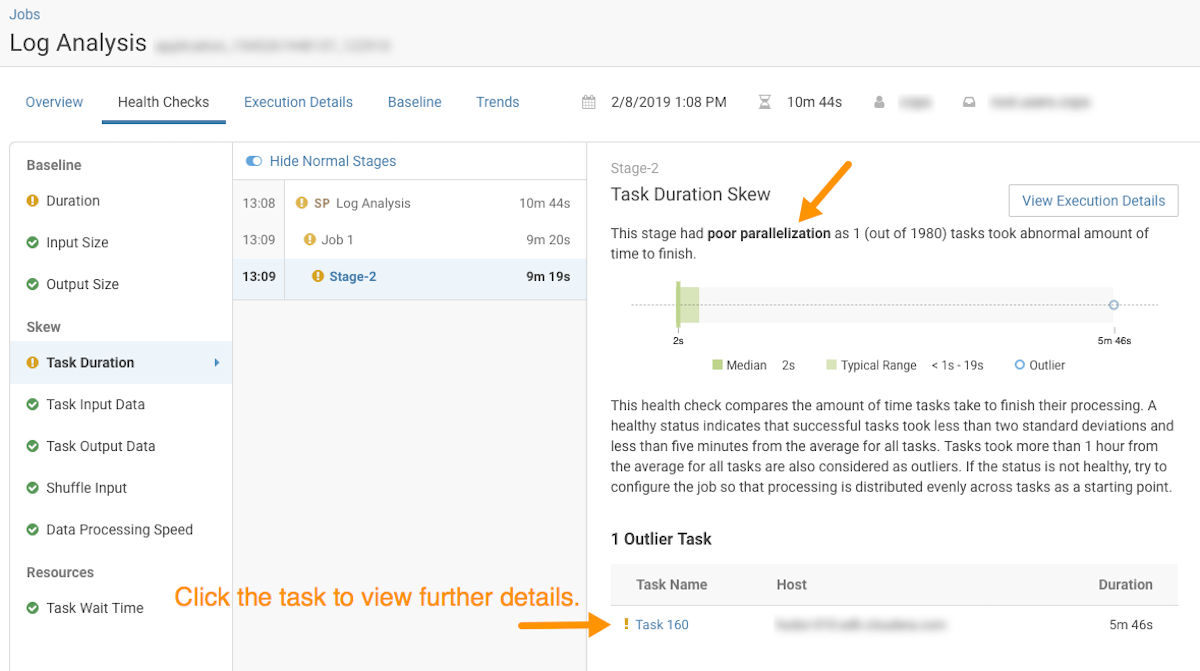
To display more information about the length of time the processing tasks took
within a job, from the Baseline column, select
Task Duration.
For example, as shown in the following image, a particular task took longer to complete than expected:
-
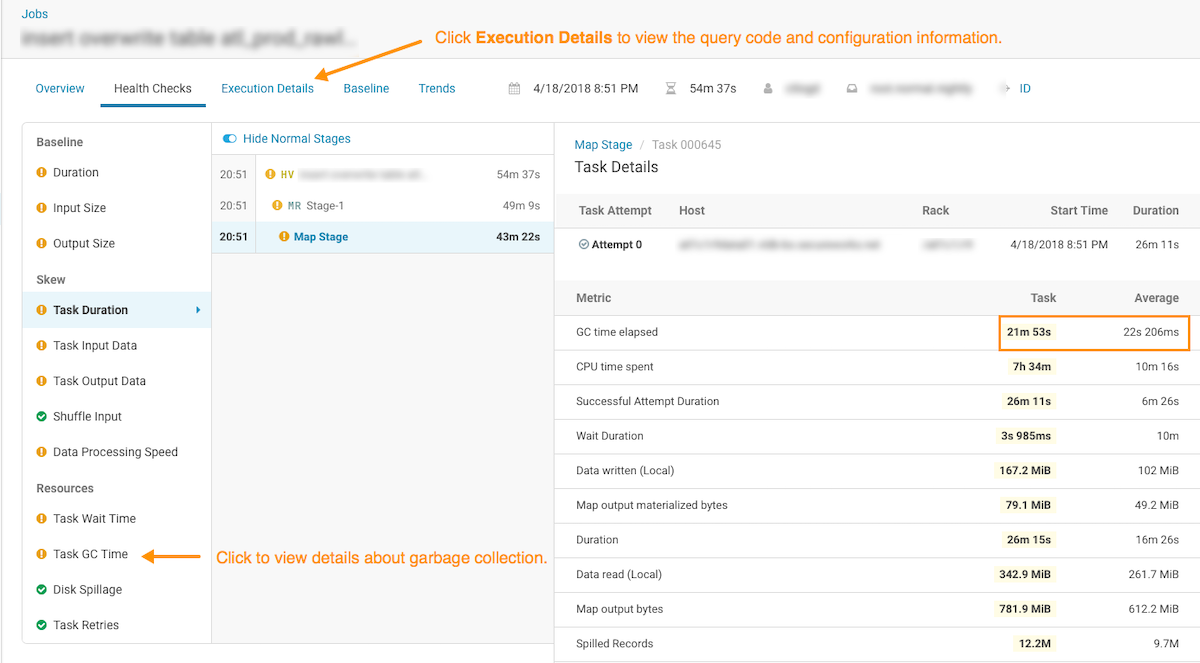
To display more information about the abnormal task, click the task, which
opens the Task Details panel.
In the following example, the Task Details show that the abnormal task took significantly more time to complete the garbage collection process than the average:
-
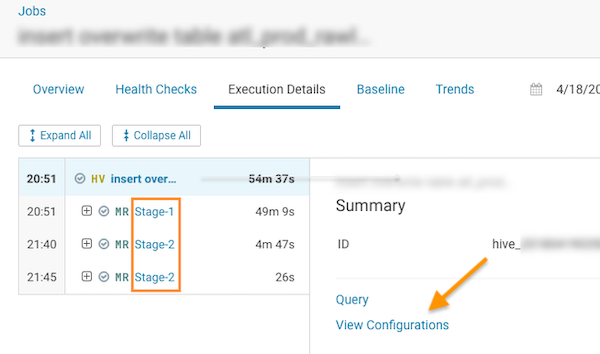
In the Task GC Time page, click the Execution
Details tab and then click one of the MapReduce stages:
-
In the Summary panel, click View
Configurations and then locate the configuration for the garbage
collection by entering the MapReduce memory configuration property name in the
Search field:
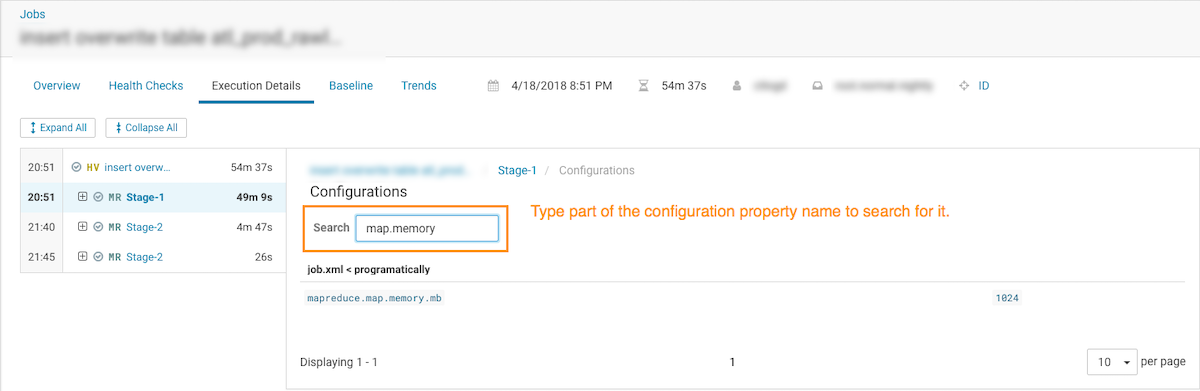
The configuration setting for the garbage collection is 1024. This value could be causing the mapper JVM to have insufficient memory and triggering too many garbage collection processes. Increasing the value will improve cluster performance and remove this task as a potential risk.