Troubleshooting an Abnormal Job Duration
Identify areas of risk from jobs running on your cluster that complete within an unusual time period.
Steps with examples from a Spark engine are included that explain how to further investigate and troubleshoot the cause of an abnormal job duration.
-
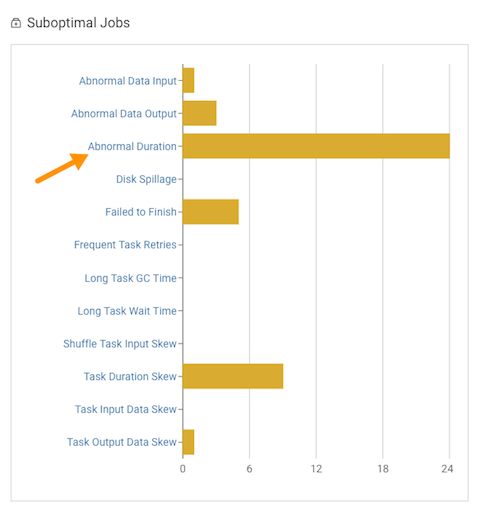
Depending on the engine you selected, in the engine's page that opens scroll
down to either the Suboptimal Jobs or the
Suboptimal Queries chart widget and click the
Abnormal Duration health check bar.
The Jobs or Queries page opens, listing all the jobs or queries that have triggered the Abnormal Duration Health check.
-
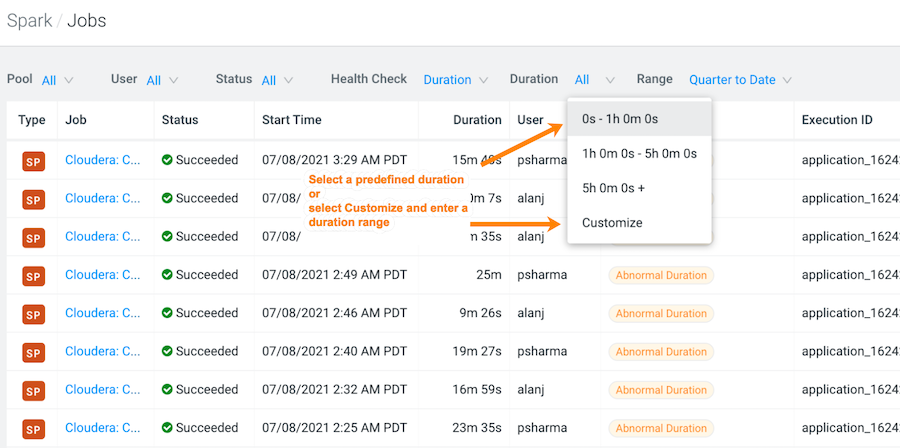
Specify a specific amount of time in which the job either ran less than or more
than the Health check rule by either selecting a predefined time duration or
selecting Customize and enter the minimum or maximum time
period from the Duration list.
-
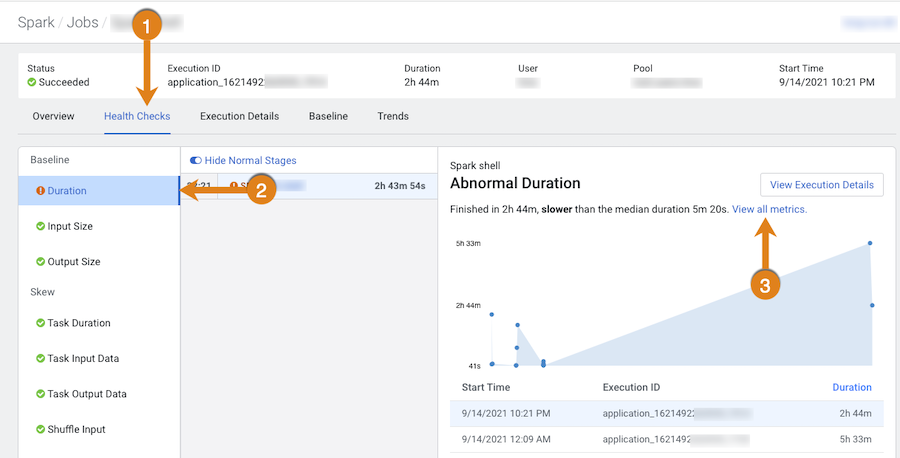
Display more information about the job's duration by selecting
Durationfrom the Baseline
section. As shown in the image below.
In the following example, the job finished much slower than the baseline duration, which is the aggregate calculated over multiple jobs.
-
Continue to analyze and search for probable causes by doing one or more of the
following:
- To display more information about the length of time the processing
tasks took within a job, select Task Duration, which
opens a panel that describes the health check, displays information about
the possible causes, and lists recommended solutions. In the following example, issues arose during Stage-9 of the job due to poor parallelization. The Recommendation section lists items for you to complete that may resolve the problem and the specific outlier tasks that produced the unusual results:
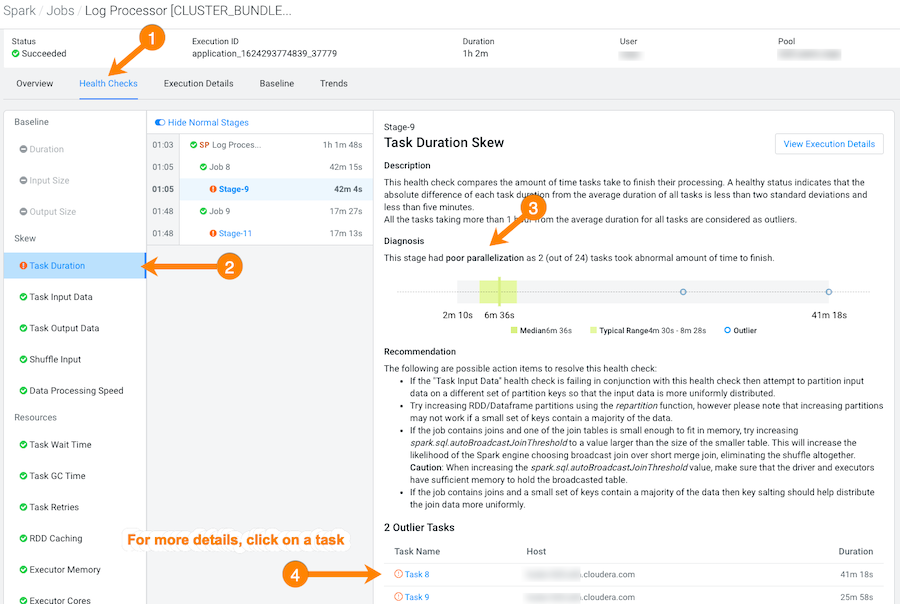
- To display more details about an outlier, click the outlier task, which
opens the Task Details panel. In the following example, the Task Details show that the outlier task took significantly more time to complete compared to previous runs. In this case, 41 minutes as compared to 8 minutes:
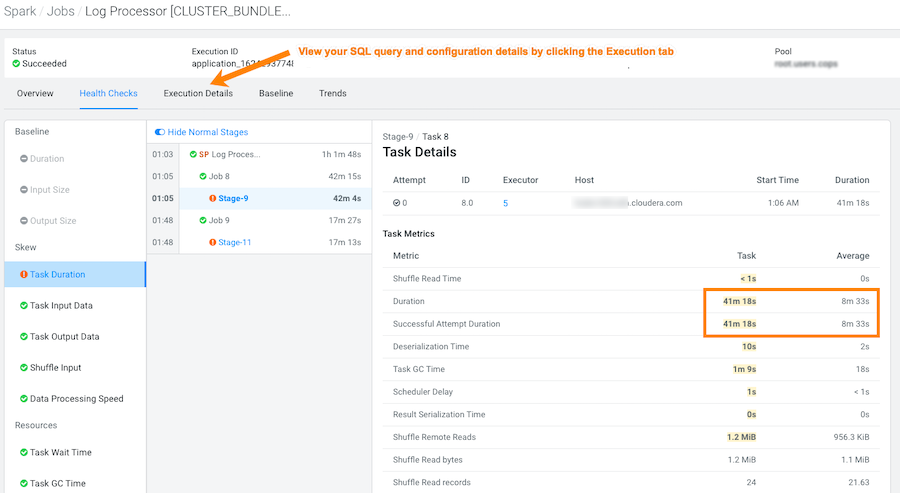
- To gain more insights about the task's duration, such as checking memory
allocation, click the Execution Details tab and then
in the Summary panel, click Configurations:
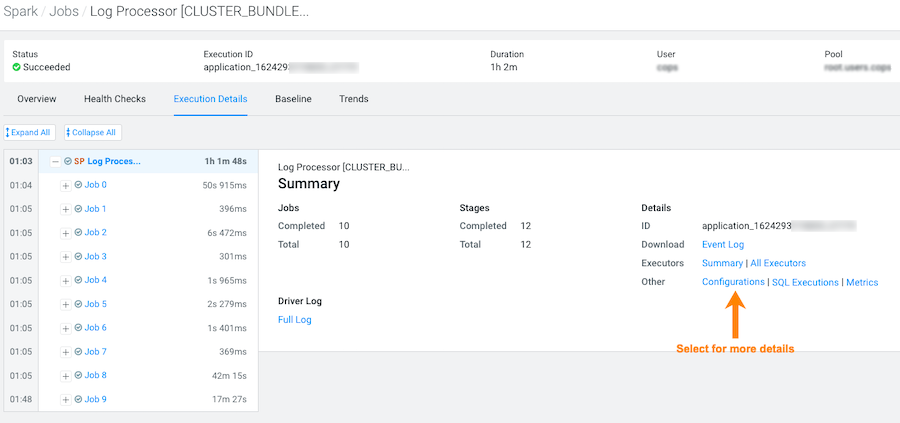
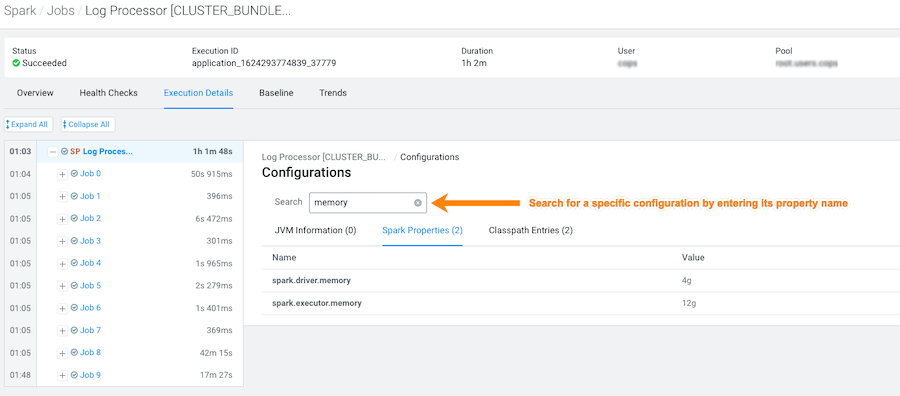
- In the Configurations panel, click the Spark
Properties tab and search for the memory configuration
settings and their values. If memory is less than the recommended value,
increasing its value will improve cluster performance:
- To display more information about the length of time the processing
tasks took within a job, select Task Duration, which
opens a panel that describes the health check, displays information about
the possible causes, and lists recommended solutions.