3.3. Looking Up Configuration Values: the Component Summary Page
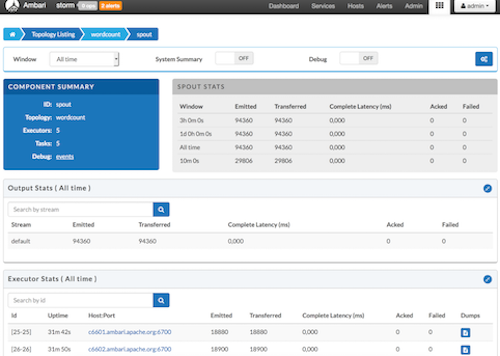
On the Component Summary page, you can drill down to a individual component in a topology to see relevant stats for the component and access debug logs and jstack outputs.

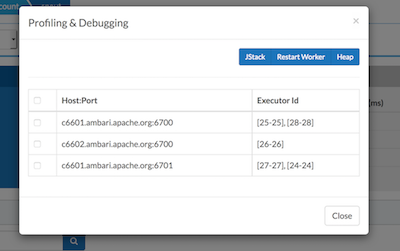
You can also debug and profile a worker JVM, by choosing the rightmost button on the Component Summary Page:

The popup window shows all worker processes running the particular spout. You can select the worker processes to take the jstack output or Heap dump, and selectively restart a worker JVM.


