Query Tab
The Query tab helps you write, plan, execute, and save queries with embedded tools for locating Hive databases and tables of your system in the same window.
Important Features of the Query Tab
Use the button to find databases. Click on a database to enable it as a selectabe database in Hive View. The button acts as a filter in case you are working with more databases than you want to work with in Hive View.
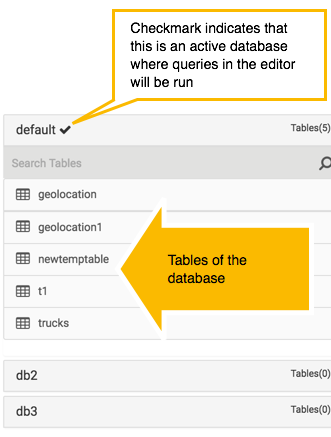
Click one or more databases in the database and tables pane (not in the DATABASE field) to designate active databases. All queries in the current tab are then run against the active database or databases.
The database and tables pane displays all the tables of the active databases in a single view.
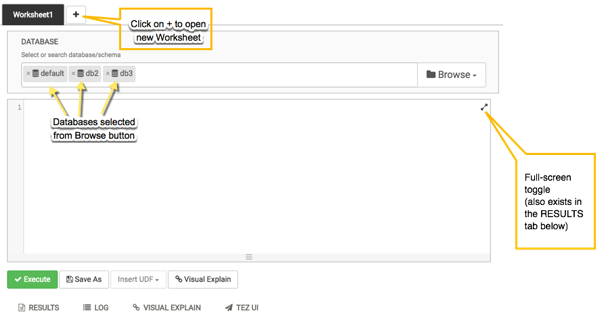
The Query Editor field and an active RESULTS tab can be toggled between compact and full-screen mode. The screenshot below shows the compact mode. Full-screen mode enlarges the query editor field, which can help you author large, complex SQL queries or browse large query results.
Use multiple Worksheet tabs to work on and analyze queries in parallel.
Query Editor and Database and Table Pane
Use the Browse button in the Query Editor to find and select databases. After you select databases and make them active in the view, they appear in the database and table pane.
How to Use the Query Editor
Enter queries in the blank field. To run a specific query, highlight it, and click Execute. All queries contained in a Worksheet tab execute sequentially, and they run in the same session.
Click the tab to view the results after a query is exeucuted.
Similarly, click the tab to view the log from an executed query.
When the first query is executed in a Worksheet, a Tez session is started. Click the tab to see details about the DAG execution.
Click Save as to save your query.
Double-click the Worksheet tab to rename the query, click OK, and then Save as to save the query with the new name.
Click on the + symbol to open a new worksheet tab. Queries executed from the new worksheet tab will execute in a different session. Queries from different worksheets can execute in parallel.
Click the double arrow icon in the upper right corner of the Query Editor to expand the Worksheet area and cover Database Explorer. Click the icon again to collapse the Worksheet and make Database Explorer available again.
Click the icon at the bottom of the Worksheet window and drag it down to expand the authoring space.
Visual Explain Plan
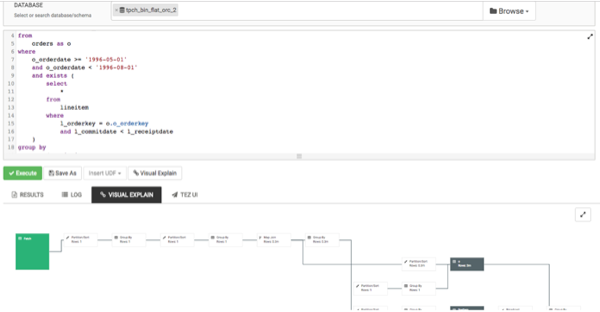
Hive View 2.0 includes a simple, graphical visualization of the Hive execution plan that focuses on key information that can help you spot expensive operations in your query.
Clicking he Visual Explain tab launches a visual explain plan.
The visual explain plan illustrates the execution of the query, regardless of whether you run the query or not. So you can use the Visual Explain feature truly as a planning tool.
![[Important]](../common/images/admon/important.png) | Important |
|---|---|
The workflow sequence of the visual explain plan is plotted beginning on the right side and proceeding to the left. |
The nodes of the explain plan contain kernels of information that help you forecast or troubleshoot execution problems. Key information of the plan includes:
Execution “cost”: The number of processed rows for each node of the visual explain plan is displayed, which gauges the resource demands of the various runtime processes of an executing query.
Labeling of runtime processes for easy comparison: Each node is identified by type of operation or process. For example, you can see which nodes represent “cheap” Map Join activity and compare them to “expensive” Partition or Sort operations.
![[Tip]](../common/images/admon/tip.png) | Tip |
|---|---|
If your query performs Partition or Sort operations on a large number of records, the query runtime is relatively long. In this case, consider tuning or rewriting the query. |
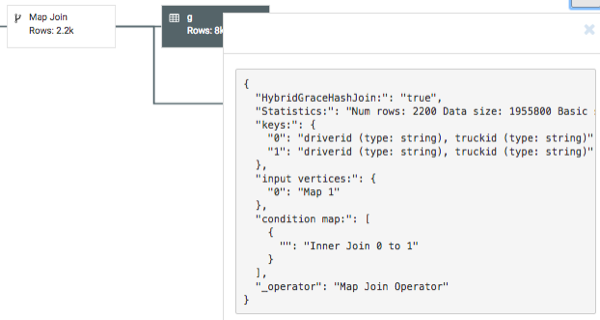
Click on a node to view detailed information about SQL operators:
Debugging Hive Query Execution Using the Tez UI
Query execution can be debugged using the embedded Tez UI. To access the Tez UI, click the TEZ UI tab at the bottom of the Query Editor window.
![[Important]](../common/images/admon/important.png) | Important |
|---|---|
Clicking the Tez UI in Hive View instantiates an Ambari Tez View for the current query. Therefore, for more information about how to use the Tez UI, see Using Tez View. |


