
AMS Architecture
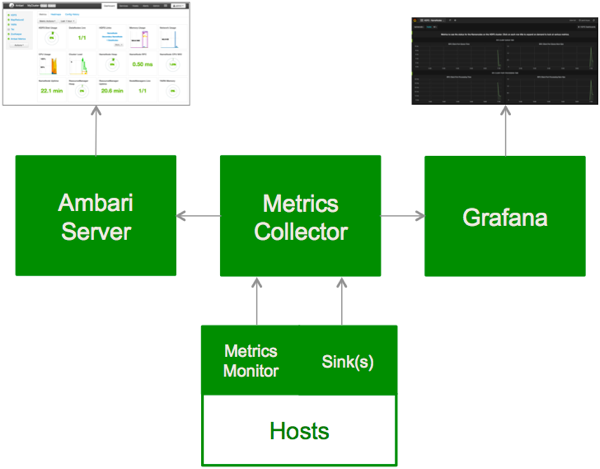
AMS has four components: Metrics Monitors, Hadoop Sinks, Metrics Collector, and Grafana.
Metrics Monitors on each host in the cluster collect system-level metrics and publish to the Metrics Collector.
Hadoop Sinks plug in to Hadoop components to publish Hadoop metrics to the Metrics Collector.
The Metrics Collector is a daemon that runs on a specific host in the cluster and receives data from the registered publishers, the Monitors, and the Sinks.
Grafana is a daemon that runs on a specific host in the cluster and serves pre-built dashboards for visualizing metrics collected in the Metrics Collector.
The following high-level illustration shows how the components of AMS work together to collect metrics and make those metrics available to Ambari.