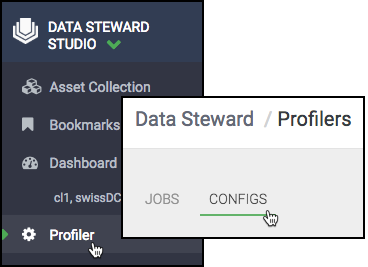
Viewing Profiler Configurations
You can monitor the overall health of individual profilers by viewing their status on .
Monitoring the profiler configurations has the following uses:
- See which profilers are active and inactive.
- View asset coverage for a particular profiler over time- for instance, if you change a configuration for a profiler, you can see if new assets become covered.

You can take the following actions:

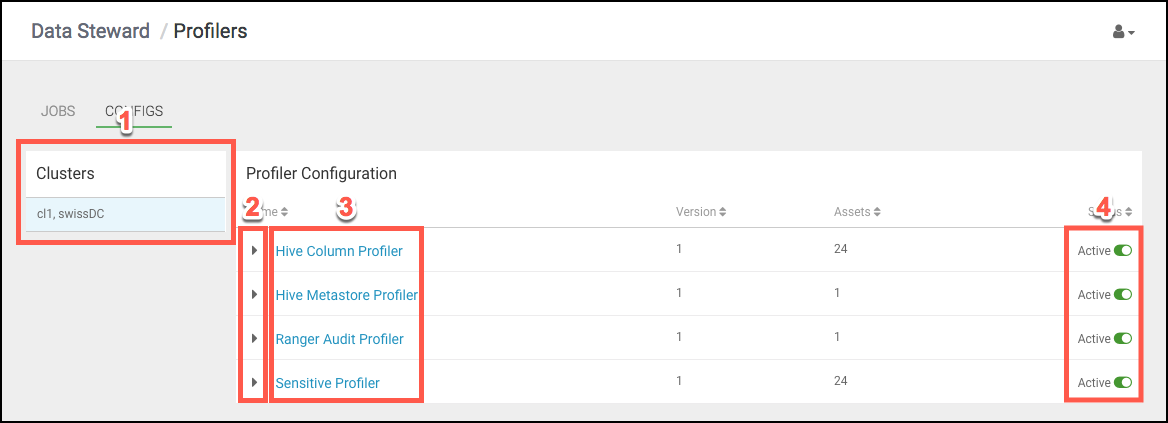
- Filter by cluster.
- Expand the execution status of an individual profiler. The percentage specifies how many assets have been profiled by this profiler on that day; the color denotes whether they were all successful, or not.
- Edit the profiler configuration.
- Toggle each profiler on/off.

