
Troubleshooting and Debugging a Stream application
At the top right corner of the APM, there is a Storm icon that takes you to the Storm Ambari view.
The Storm Ambari View provides the following capabilities for deeper troubleshooting and debugging:
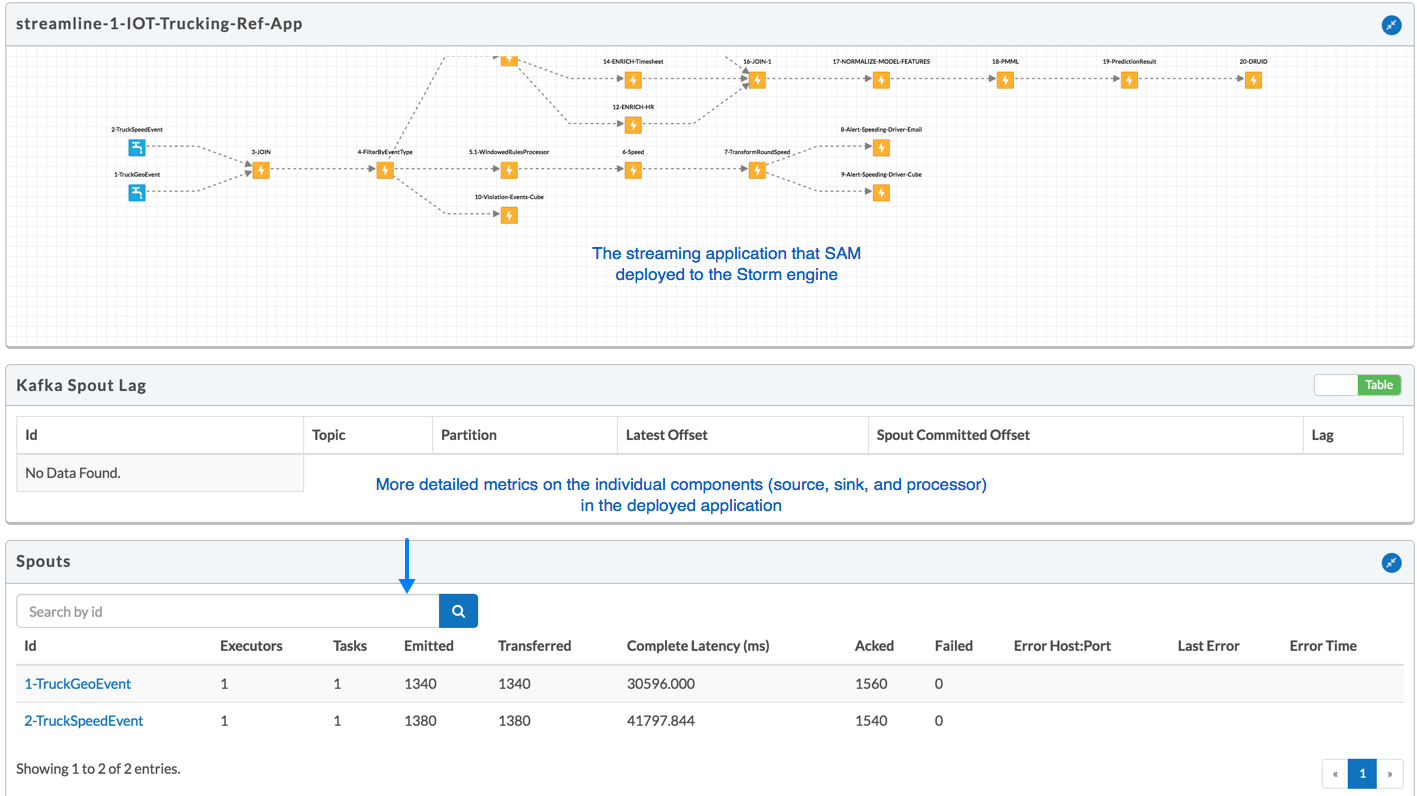
Topology View and Metrics: shows a visual representation of the deployed topology and topology level Metrics.
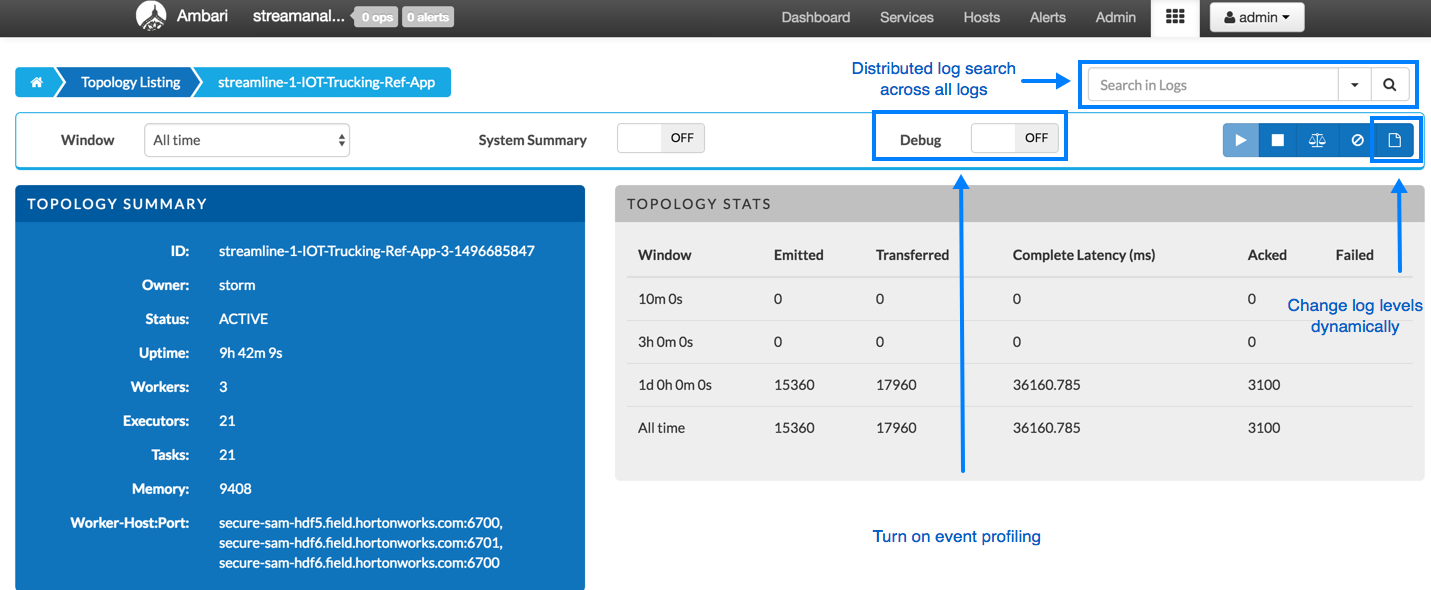
Distributed Log Search: allows users to search all logs across supervisor machines for a topology; results can include zipped logs.
Dynamic Log Levels: allows Users and Administrators to dynamically change the log level settings for a running topology.
Topology Event Inspector: allows viewing of tuples flowing through the topology along with the ability to turn on/off debug events without having to stop/restart the entire topology.
Dynamic Worker Profiling: allows users to request worker profile data directly from the Storm UI (Heap Dumps, JStack Output, JProfile).
Use the first portion of the Ambari Storm View to review the topology summary and statistics, set event profiling, search logs, and dynamically change them.
Scroll down to review the deployed topology and see metrics about its components.