Lineage Graph
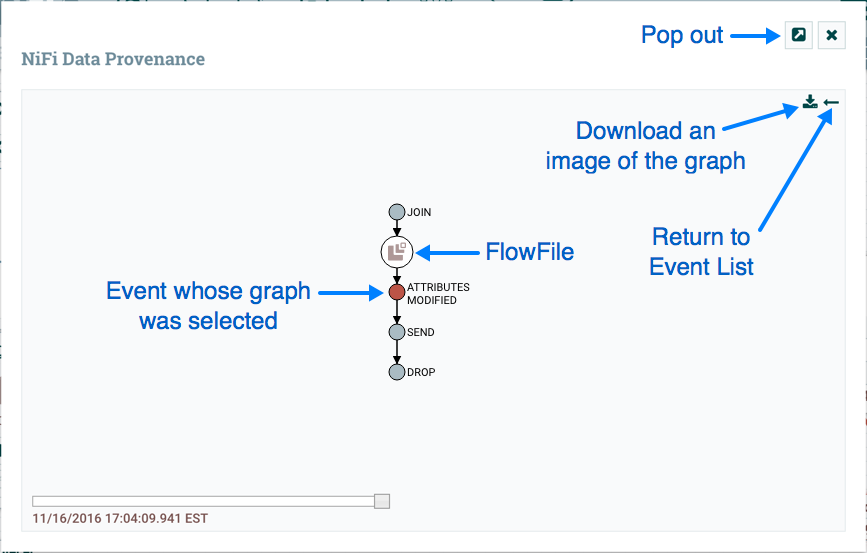
In addition to viewing the details of a Provenance event, we can also view the lineage of the FlowFile involved by clicking on the Lineage Icon ( ![]() ) from the table view.
) from the table view.
This provides us with a graphical representation of exactly what happened to that piece of data as it traversed the system:

From here, we can right-click on any of the events represented and click the View
Details menu item to see the Event Details. This graphical representation shows
us exactly which events occurred to the data. There are a few "special" event types to be
aware of. If we see a JOIN, FORK, or CLONE event, we can right-click and choose to Find
Parents or Expand. This allows us to see the lineage of parent FlowFiles and children
FlowFiles that were created as well.
The slider in the bottom-left corner allows us to see the time at which these events occurred. By sliding it left and right, we can see which events introduced latency into the system so that we have a very good understanding of where in our system we may need to provide more resources, such as the number of Concurrent Tasks for a Processor. Or it may reveal, for example, that most of the latency was introduced by a JOIN event, in which we were waiting for more FlowFiles to join together. In either case, the ability to easily see where this is occurring is a very powerful feature that will help users to understand how the enterprise is operating.

