The Services view gives you access to detailed information on each of the services running in your cluster. It also allows you to start and stop the service, run smoke tests, and change configuration details.

The Services view is divided into seven sections:
The Services navigation panel on the left gives you a quick look at the status of your services. The color of the dot next to the left of service name tells you the service running state and a small rectangle to the right lets you know if there are any alerts assigned to it. To move the larger screen display from showing information about one service to another, click the service name. To stop or start all of the services at once, use the Start All or Stop All buttons, outlined in magenta.
The Services Summary tab displays basic information about the selected service. For services that run as master/slave sets, this is the same panel that is displayed on the Classic Dashboard when you click the triangle next to the service name. Use the View Host links, marked in gray above to move to the Host Details view of the host that is running the service. Clicking Configs, outlined in orange above, opens a second tab, the Configuration Update tab.
The Configuration Update tab allows you to update configurations for your service. The screen that appears is familiar from the Install wizard configuration page. Once you have made your changes, use the management header to stop and restart the service.

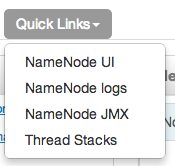
Quick Links, outlined in light green, takes you to additional sources of information about this service. In the case of HDFS, for example, it contains links to the native NameNode GUI, NameNode logs, the NameNode JMX output, and thread stacks for the service. Not all Services pages include Quick Links.

The Alerts and Health Checks panel displays the results of the health checks performed on your cluster by Nagios. Alerts display a brief summary of the issue and its rating. They are sorted by descending severity, followed by descending time. To access more detailed information, click the link in the upper right corner of the panel, outlined in yellow above. This opens the native Nagios GUI. Use the username and password you set up during installation to log in.
The management header, outlined in blue, gives you a convenient way to stop and start an individual service. You can also use Maintenance to perform smoke tests on the service, for example, if you have updated the service's configuration.

The Metrics panel displays a set of charts measuring common metrics for the service. Hover your mouse above a particular chart to see a legend and click a specific metric type to select or deselect it. Click the chart to see a larger version. To get more information, click the link in the upper right corner of the panel, outlined in purple. This opens the native Ganglia GUI.

