

Chapter 9. Deploying and Managing Apache Storm Topologies
Use the command-line interface to deploy a Storm topology after packaging it in a jar. For example, use the following command to deploy WordCountTopology from the storm-starter jar:
storm jar storm-starter-<starter_version>-storm-<storm_version>
 .jar storm.starter.WordCountTopology WordCount -c nimbus.host=sandbox.hortonworks.com
Point a browser to the following URL to access the Storm UI and to manage deployed topologies.
http://<storm-ui-server>:8080
![[Note]](../common/images/admon/note.png) | Note |
|---|---|
You may need to configure Apache Storm to use a different port if Ambari is also running on the same host with Apache Storm. Both applications use port 8080 by default. |
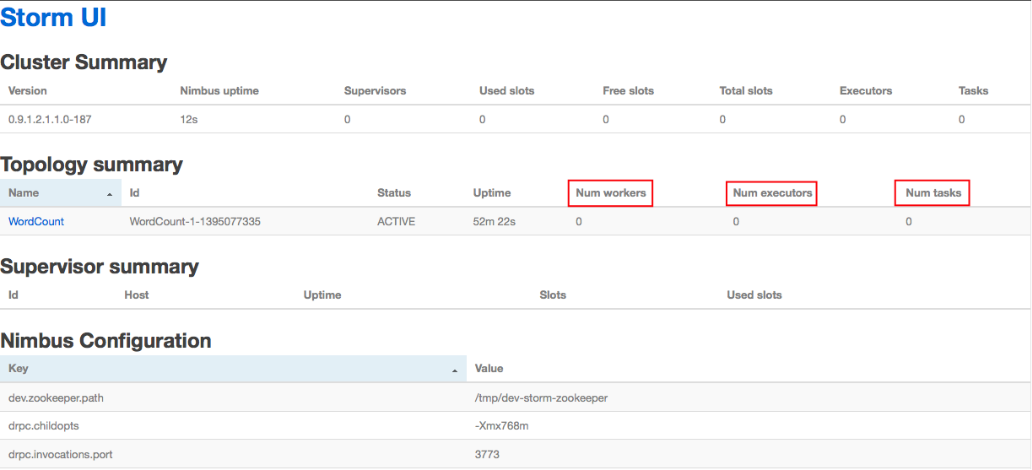
In the image above, no workers, executors, or tasks are running. However, the status of the topology remains active and the uptime continues to increase. Storm topologies, unlike traditional applications, remain active until an administrator deactivates or kills them. Storm administrators use the Storm user interface to perform the following administrative actions:
Table 9.1. Topology Administrative Actions
Topology Administrative Action | Description |
|---|---|
Activate | Returns a topology to active status after it has been deactivated. |
Deactivate | Sets the status of a topology to inactive. Topology uptime is not affected by deactivation. |
Rebalance | Dynamically increase or decrease the number of worker processes and/or executors. The administrator does not need to restart the cluster or the topology. |
Kill | Stops the topology and removes it from Apache Storm. The topology no longer appears in the Storm UI, and the administrator must deploy the application again to activate it. |
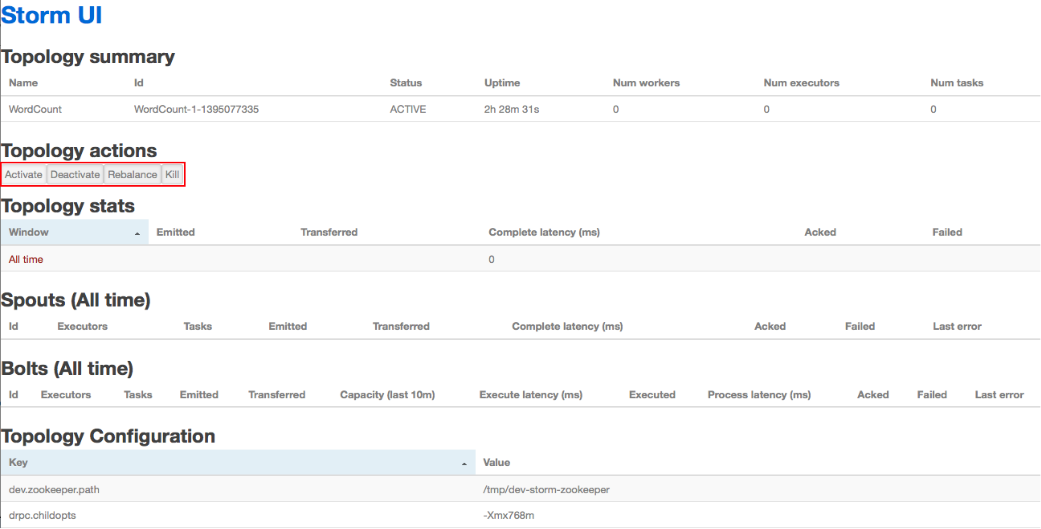
Click any topology in the Topology Summary section to launch the Topology Summary page. Administrators perform any of the topology actions in the table above by clicking the corresponding button, shown in the following image.
The Executors field in the Spouts and Bolts sections show all running Storm threads, including the host and port. If a bolt is experiencing latency issues, Storm developers should look here to determine which executor has reached capacity. Click the port number to display the log file for the corresponding executor.