As administrator, you can monitor a cluster to conserve resources when running low-latency analytical processing (LLAP). You can monitor the queries in real-time using the YARN ResourceManager Web UI or YARN command-line tools. You can view LLAP app information and HiveServer Interactive logs using the HiveServer2 Interactive UI.
After setup, Hive LLAP is transparent to Apache Hive users and business intelligence tools.
Interactive queries run on Apache Hadoop YARN. For example, you
can run a large Hive LLAP cluster during the day for BI tools, and then reduce usage during
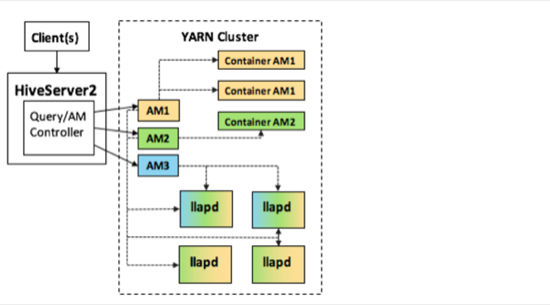
nonbusiness hours to use the cluster resources for ETL processing. The following diagram shows
how LLAP fits into your cluster:
On your cluster, an extra HiveServer instance is installed that is dedicated to interactive
queries. You can see this HiveServer instance listed in the Hive Summary page of Ambari.
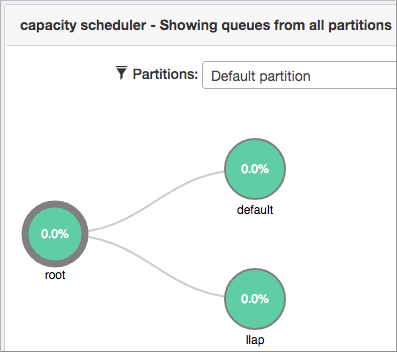
In the YARN ResourceManager UI, you can see the queue of Hive LLAP daemons or running
queries:
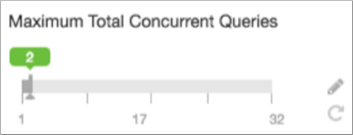
The Apache Tez ApplicationMasters are the same as the selected concurrency. If you selected a
total concurrency of 5, you see 5 Tez ApplicationMasters. The following example shows selecting a
concurrency of 2: