Setting up Prometheus for Streams Messaging Manager
Get started with setting up and using Prometheus for Streams Messaging Manager (SMM). You can use Prometheus as the metrics store for SMM. Its use is recommended over Cloudera Manager if your deployment includes a significantly large number Kafka entities that you want to monitor.
Cloudera Manager metrics overview
A metric is a property that can be measured to quantify the state of an entity or activity. They include properties such as the number of open file descriptors or CPU utilization percentage across your cluster.
Cloudera Manager monitors a number of performance metrics for services and role instances running on your clusters. These metrics are monitored against configurable thresholds and can be used to indicate whether a host is functioning as expected or not. You can view these metrics in the Cloudera Manager Admin Console.
Cloudera agents collect the metrics from individual brokers and report them to Cloudera Manager once in a minute (through Heartbeat). The collected metrics are stored in Cloudera Manager's database to query or search for historical data.
Cloudera Manager provides a default metric store for SMM. SMM fetches the required metrics from Cloudera Manager whenever required and caches the subset of metrics in the SMM server for which the historical values appear in the SMM UI. The cache refresh is configurable, the default is 50 seconds.
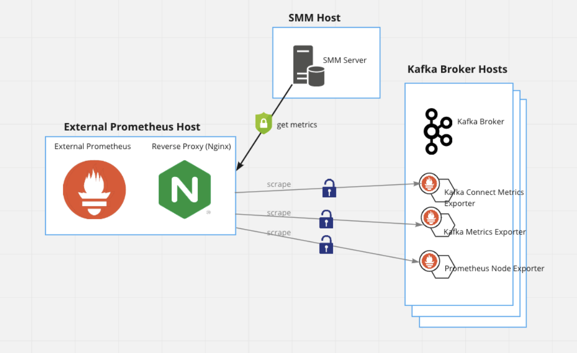
Prometheus overview
Prometheus is a metrics store that pulls metrics from different endpoints which you configure. Prometheus is not the default metric store for SMM. If you want to use Prometheus as the metrics store for SMM, you need to download and configure it. Prometheus supports a larger number of time series entities compared to the Cloudera Manager metrics store.
If you use Prometheus, you can configure the roll up policy, delete specific time series entities, and configure scrape interval and metrics retention period.
- Kafka
Kafka exposes a Prometheus metrics endpoint for Kafka metrics to be pulled.
- Kafka Connect
Kafka Connect, through configuration, exposes a Prometheus endpoint for Kafka connect metrics to be pulled.
- Prometheus Node Exporter
You need to configure a separate Node Exporter on each Kafka broker host and enable Prometheus to pull the system metrics.
SMM queries Prometheus for metrics over time. Prometheus fetches the metrics from the endpoints.
- TLS
- TLS with basic authentication
- mTLS